
Growth analytics shows what shoppers do with RecurX on your storefront: how often the subscription widget is seen, how many shoppers add to cart and whether they pick Subscribe or one-time, which bundle pack they choose, and how many finish the product quiz. For revenue, churn and retention, use Signal Analytics instead.
Step 1: Open Growth analytics
- In your Shopify admin, open Apps → RecurX Subscriptions → Growth.
- The Growth performance card shows Widget views, Shoppers interacted, Add-to-cart rate, Subscribed and Bundle picks, with a status such as Converting.
- Click View report.

Tip: The report is also linked from the quiz and volume-bundle pages, which open it on the matching tab.
Step 2: Choose the period and read the Overview
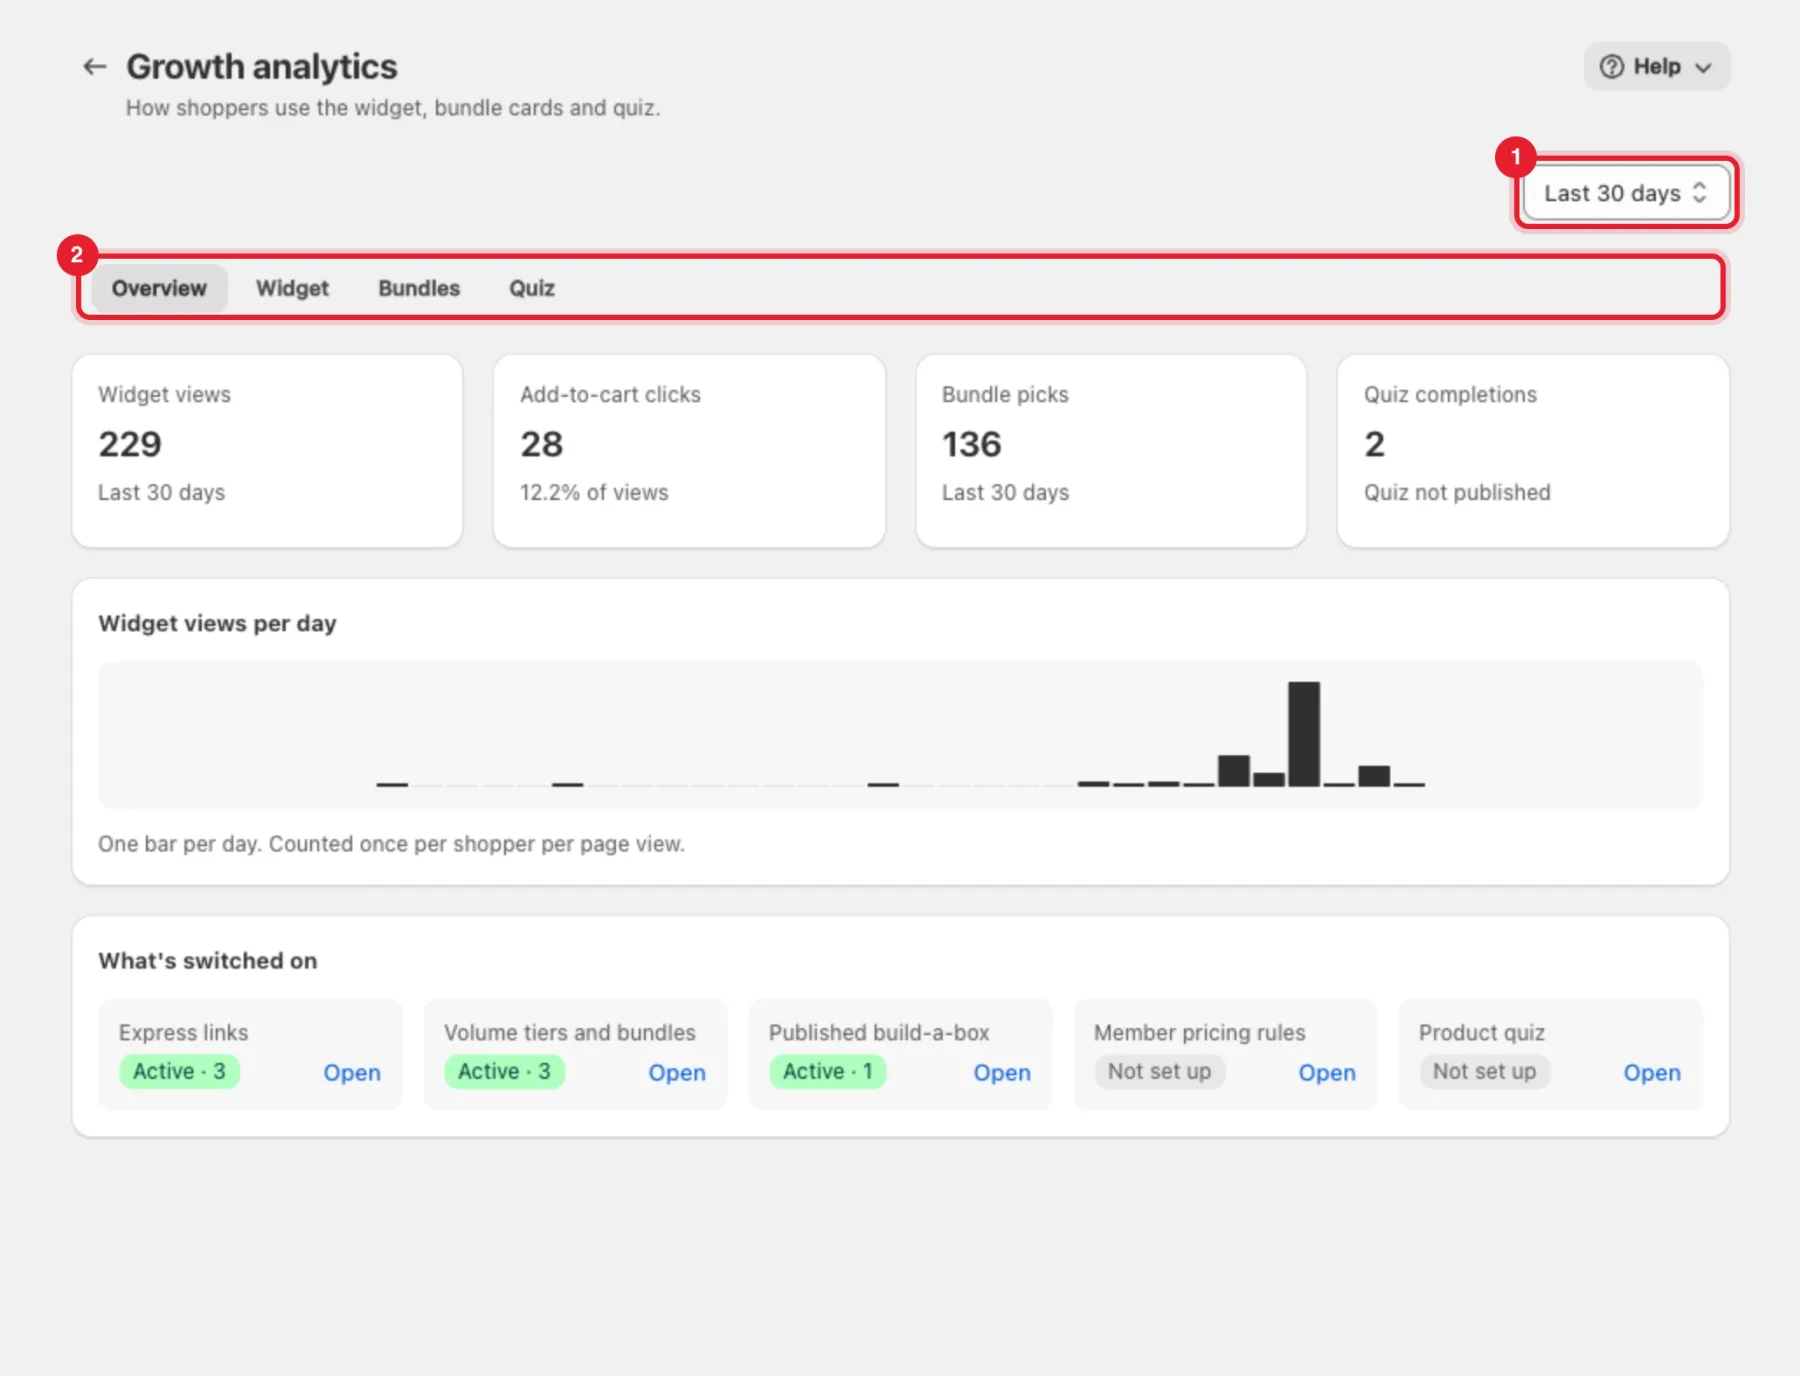
- Pick the period (1): Last 7 days, Last 30 days or Last 90 days.
- The tabs (2) are Overview, Widget, Bundles and Quiz.
The Overview tab shows Widget views, Add-to-cart clicks (with the rate as a share of views), Bundle picks and Quiz completions, then a Widget views per day chart. Views are counted once per shopper per page view.
Step 3: Check what's switched on
What's switched on lists your growth tools — Express links, Volume tiers and bundles, Published build-a-box, Member pricing rules and Product quiz — each Active (with how many) or Not set up. Click Open to go to that tool.

Step 4: Read the widget funnel
Open the Widget tab:
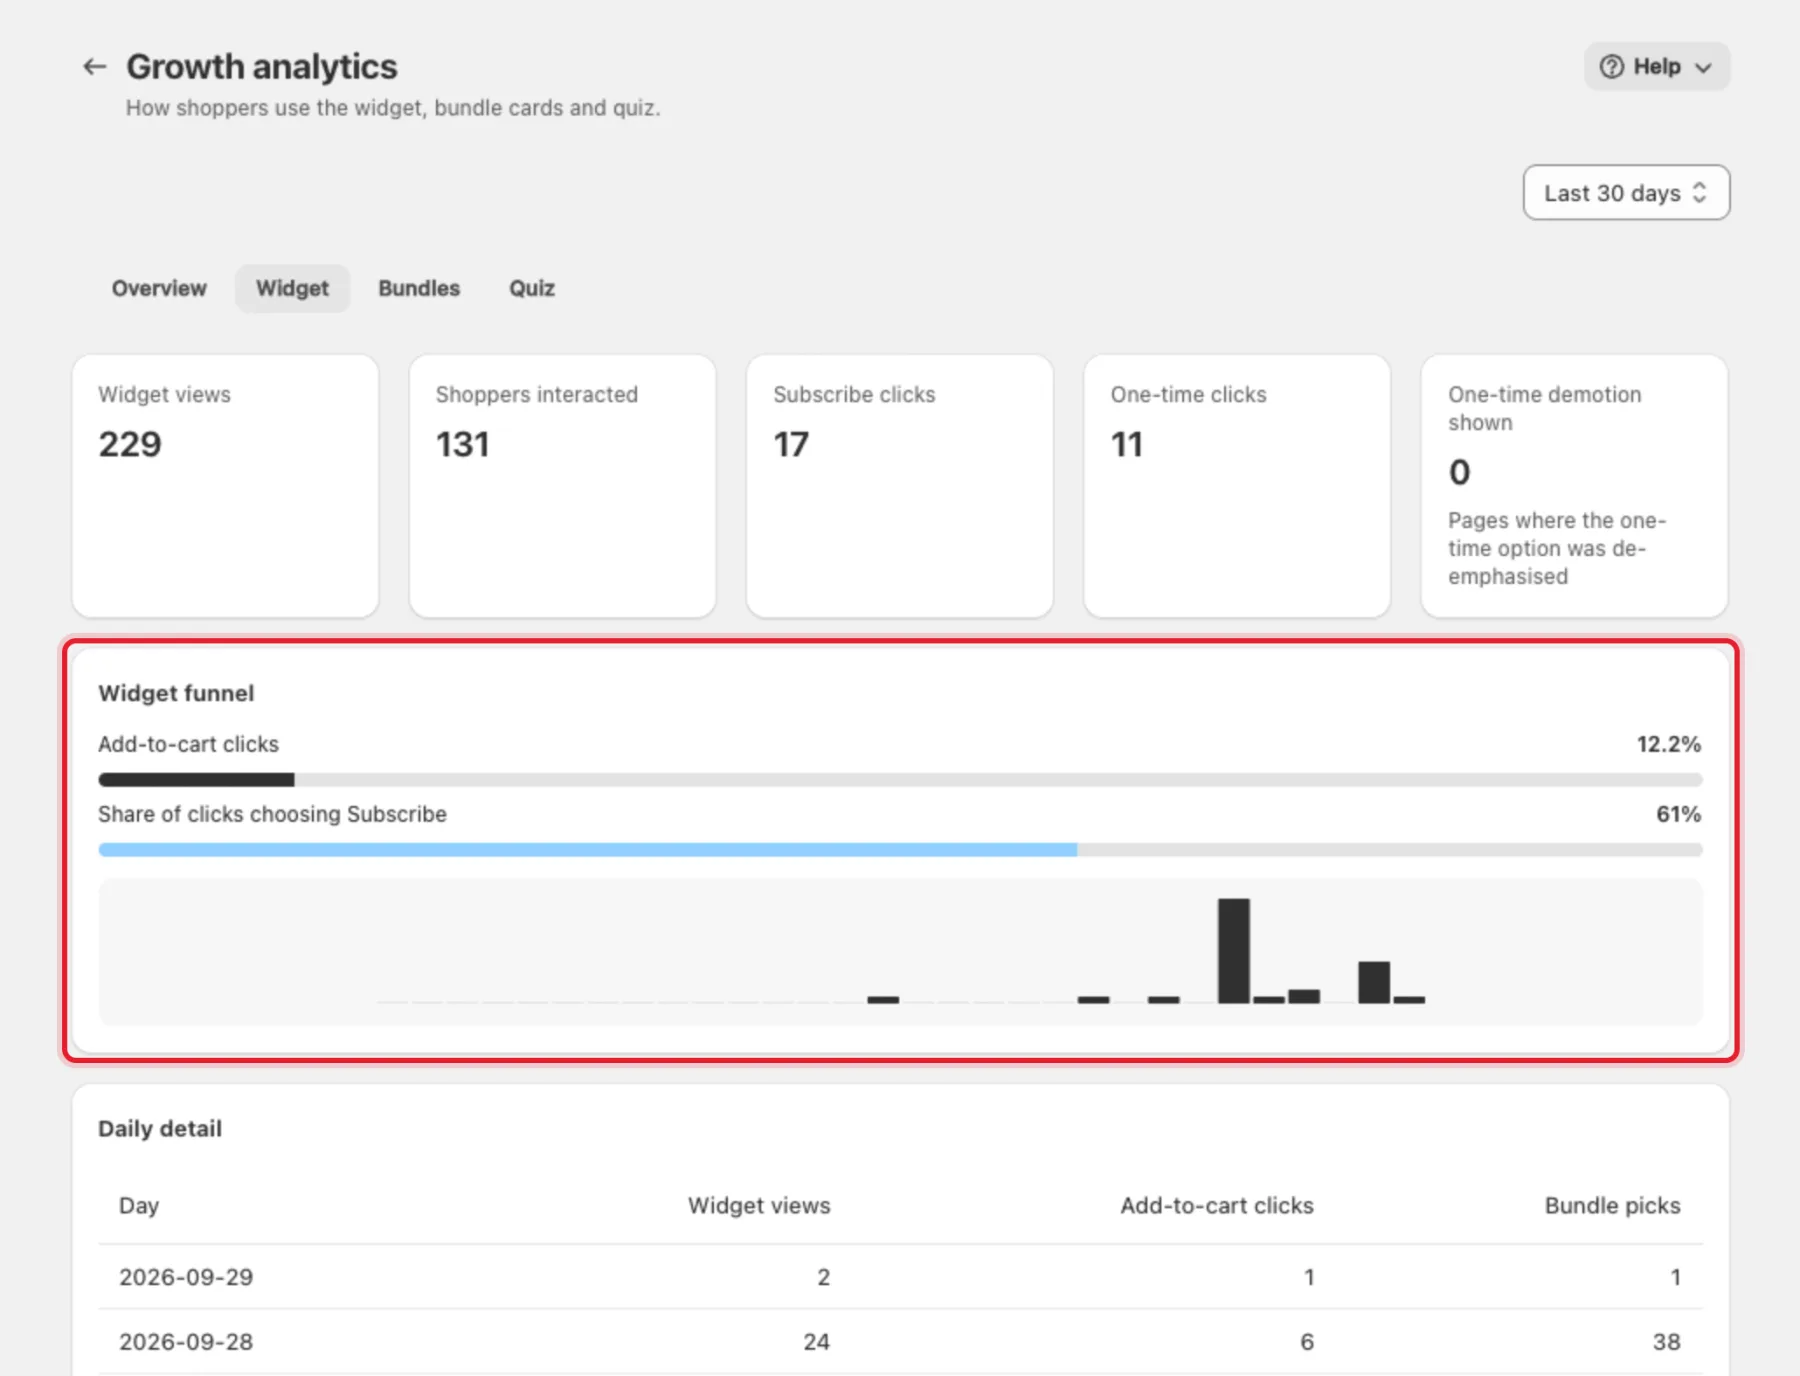
- Widget views, Shoppers interacted (shoppers who used the widget), Subscribe clicks and One-time clicks.
- One-time demotion shown — pages where the one-time option was de-emphasised.
- Widget funnel — Add-to-cart clicks as a share of views, and the Share of clicks choosing Subscribe.
- Daily detail — views, add-to-cart clicks and bundle picks for each day.
Step 5: See which bundle pack shoppers pick
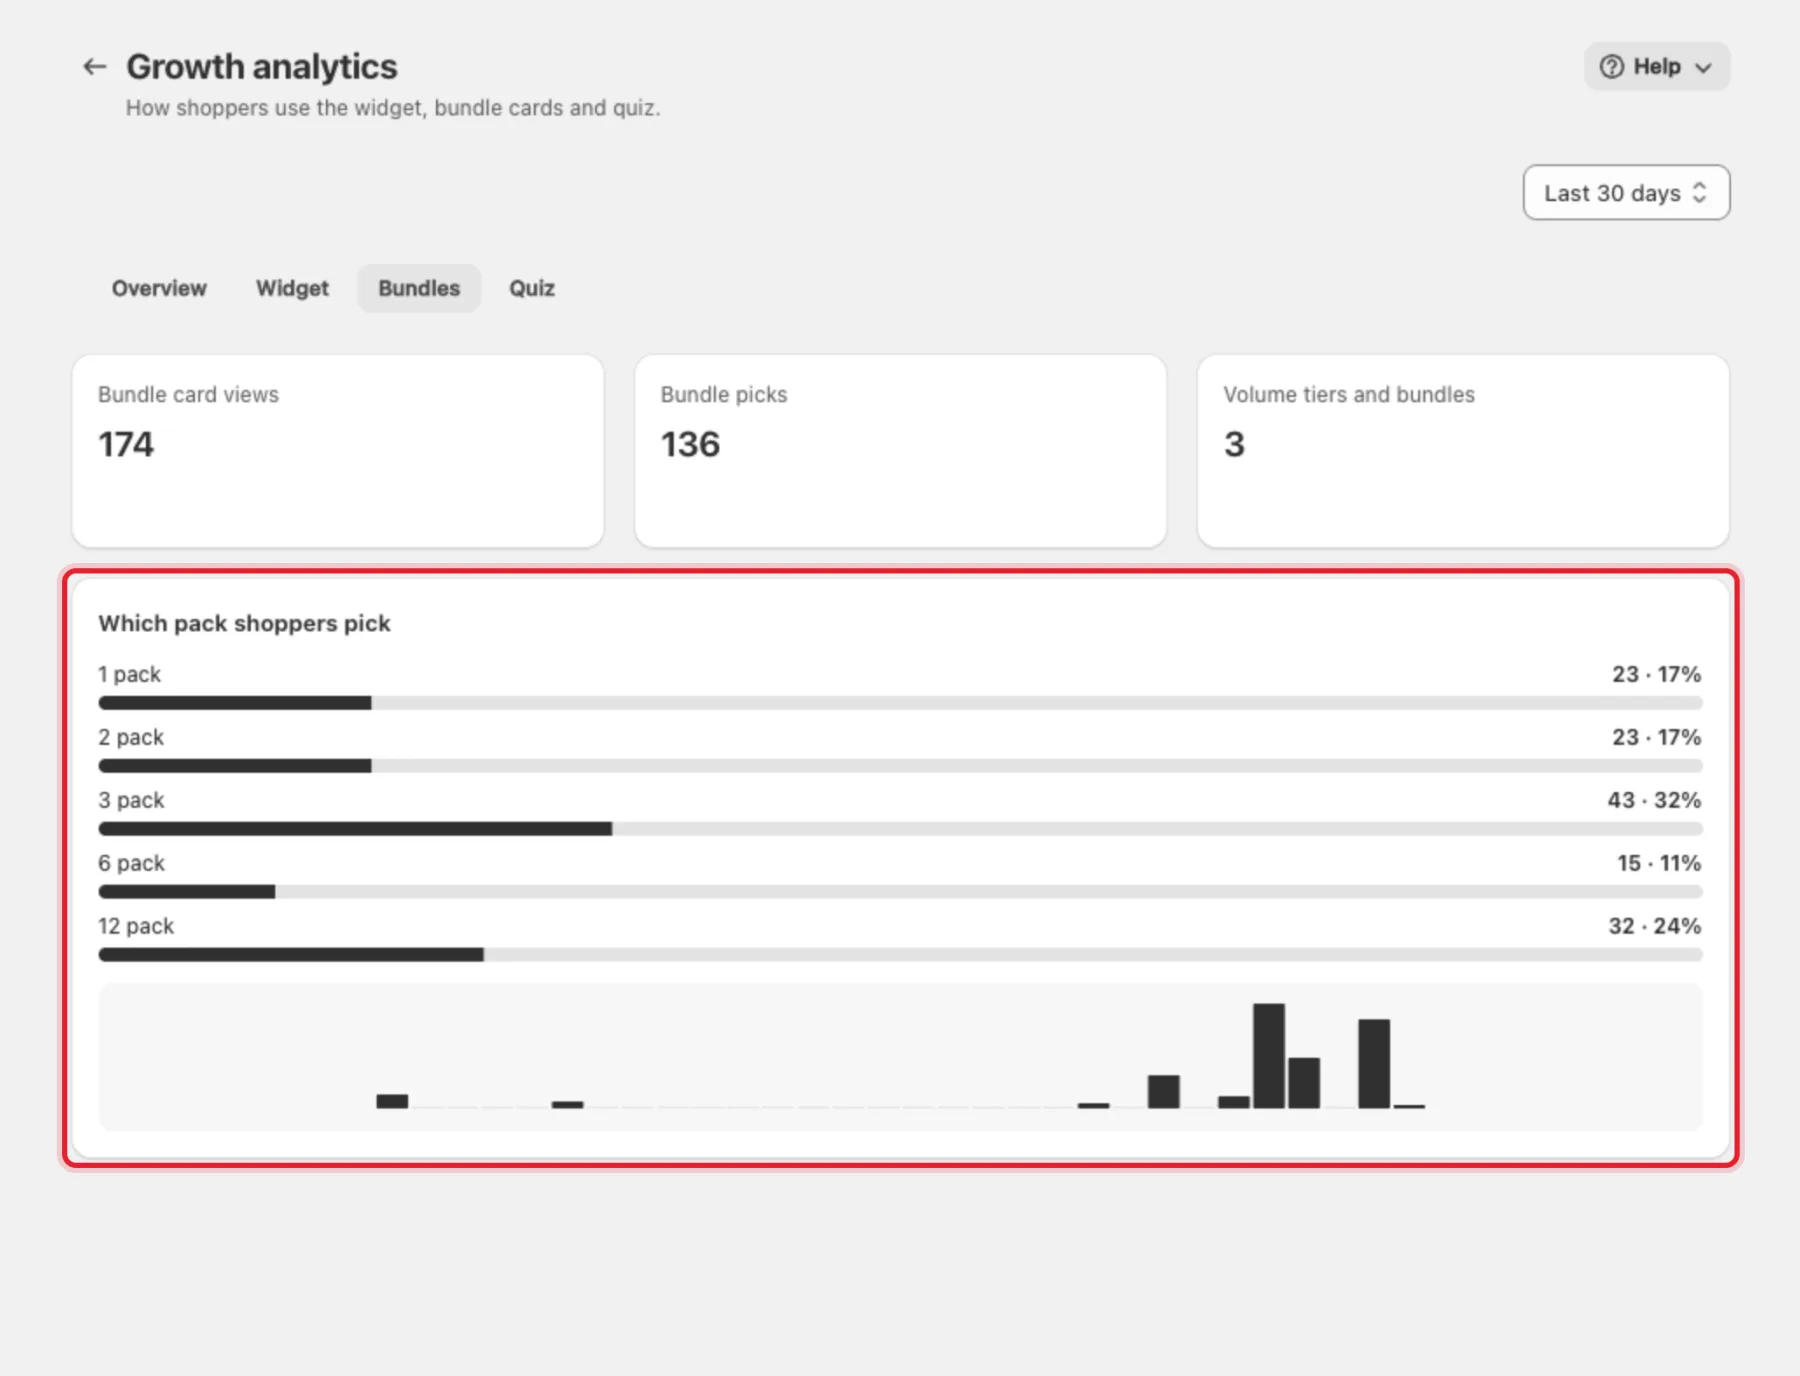
Open Bundles for Bundle card views, Bundle picks and how many Volume tiers and bundles you have. Which pack shoppers pick shows each pack size with its number of picks and share. With no picks yet, a button takes you to the volume discount page.
Step 6: Check quiz completions
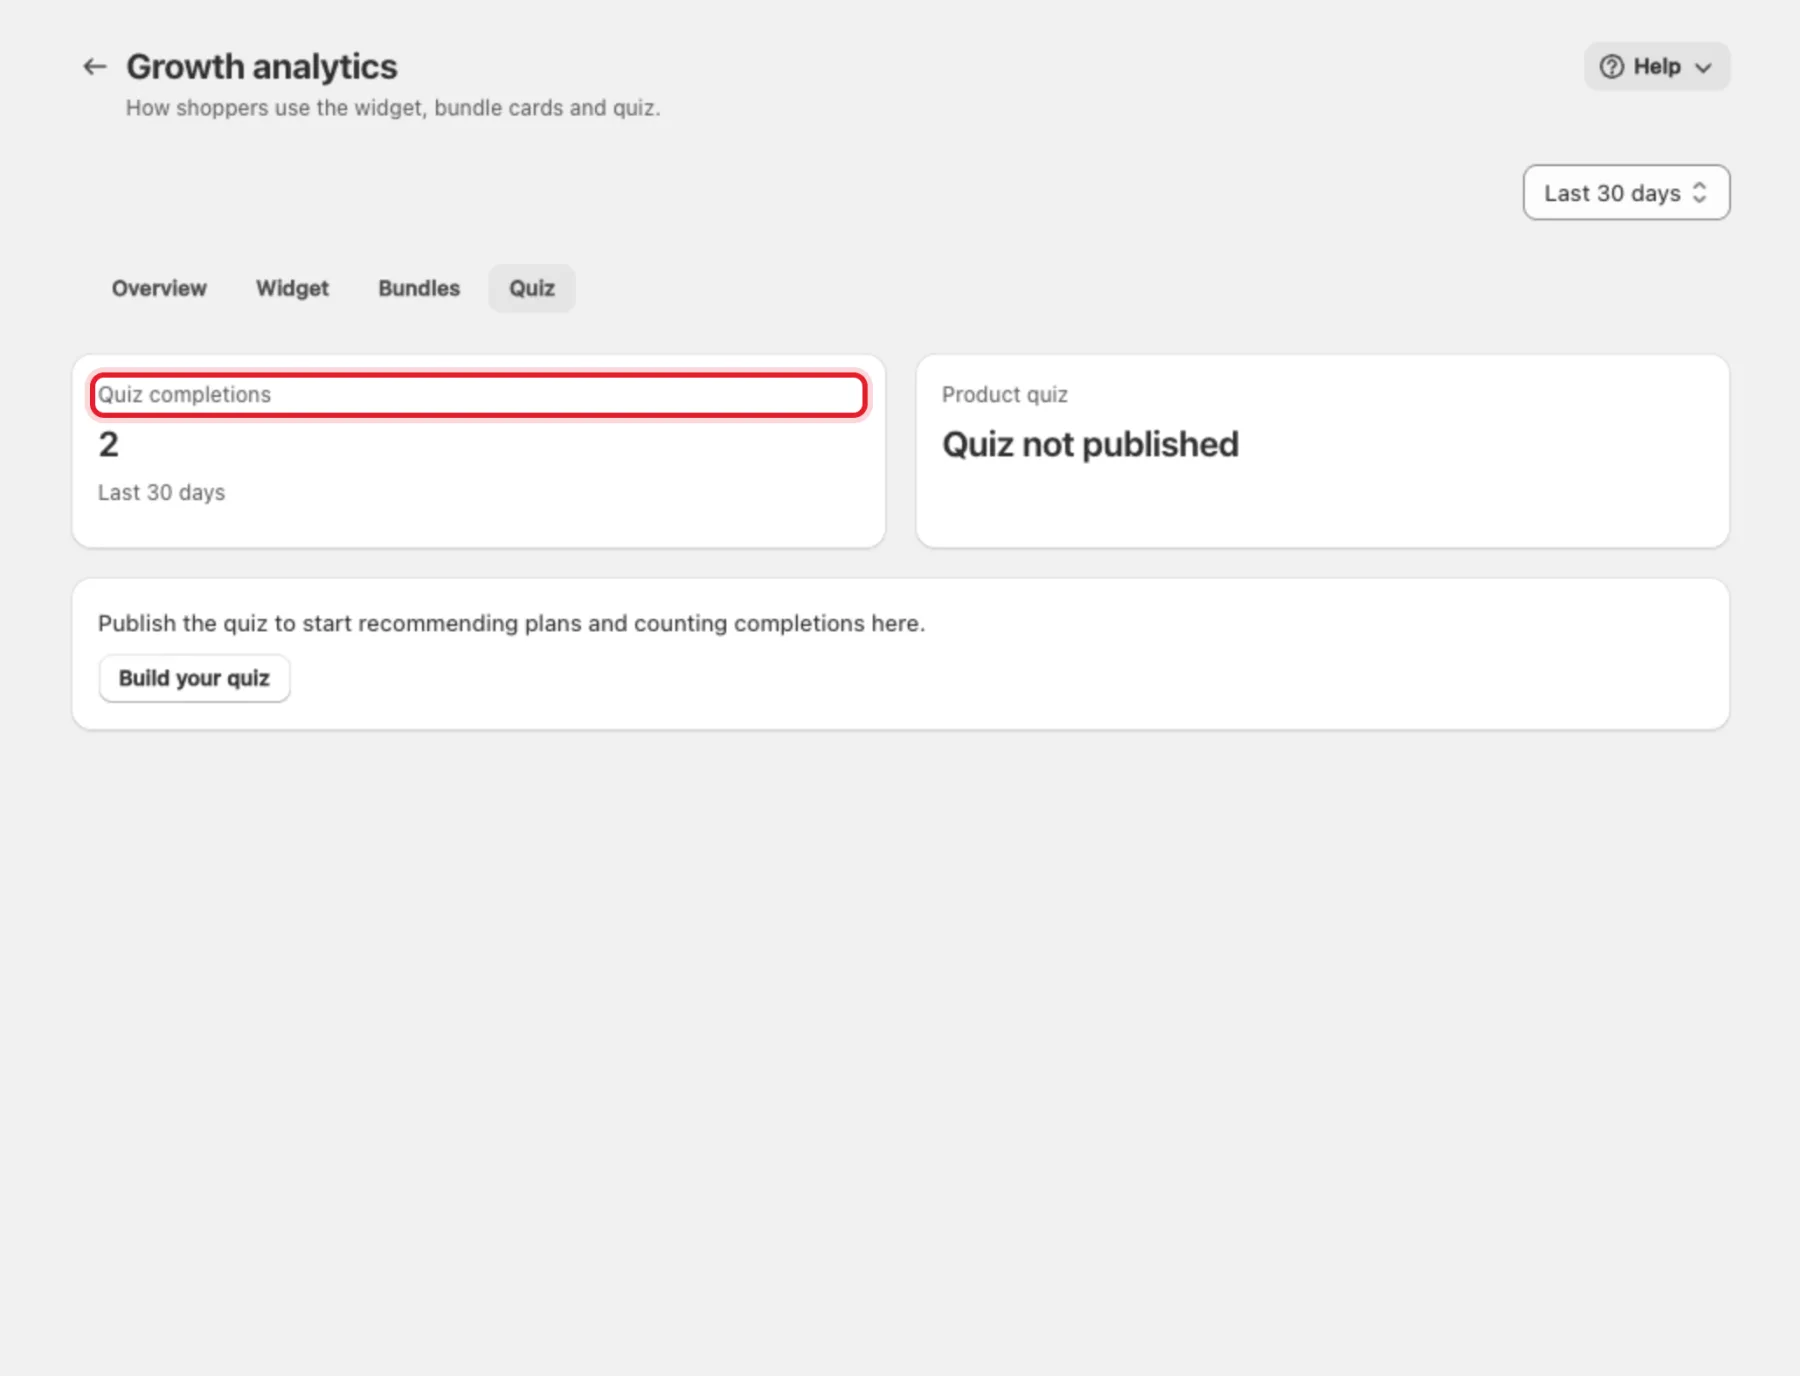
Open Quiz for Quiz completions in the period and whether your Product quiz is live (Quiz is live or Quiz not published). If it isn't published, click Build your quiz.
No data yet?
If shoppers haven't seen the widget in the period, the report says No storefront signal in the last 30 days yet (or 7 or 90). Check that the widget is turned on in your theme — see Install and customize the subscription widget. Click Explore with sample data to preview the charts with illustrative numbers; click Exit sample data to go back. Sample data only replaces the storefront numbers — What's switched on always shows your real setup.
FAQ
- Where are clicks on my Express links? On Growth → Express links: the Clicks column shows the last 30 days and all-time.
- Where is subscription revenue? In Signal Analytics. Its Attribution tab shows revenue by channel, including the storefront widget and checkout links.