
There isn't a separate Cart analytics page in RecurX. If you open an old link to it, you land on Express links. Cart activity is measured in two reports instead:
- Signal Analytics → Revenue → More reports → Revenue attribution — events from the storefront widget, including the cart widget (for example Cart widget subscribe from the cart subscription widget, a Pro feature), and a Cart upsells channel for cart drawer cross-sells.
- Growth analytics → Widget — add-to-cart clicks from the subscription widget on product pages, split into Subscribe and one-time.
Both follow the date range or period you pick.
Step 1: Open Revenue attribution in Signal Analytics
- In your Shopify admin, open Apps → RecurX Subscriptions and click Signal Analytics in the sidebar.
- Pick a date range at the top left, and open the Revenue tab.
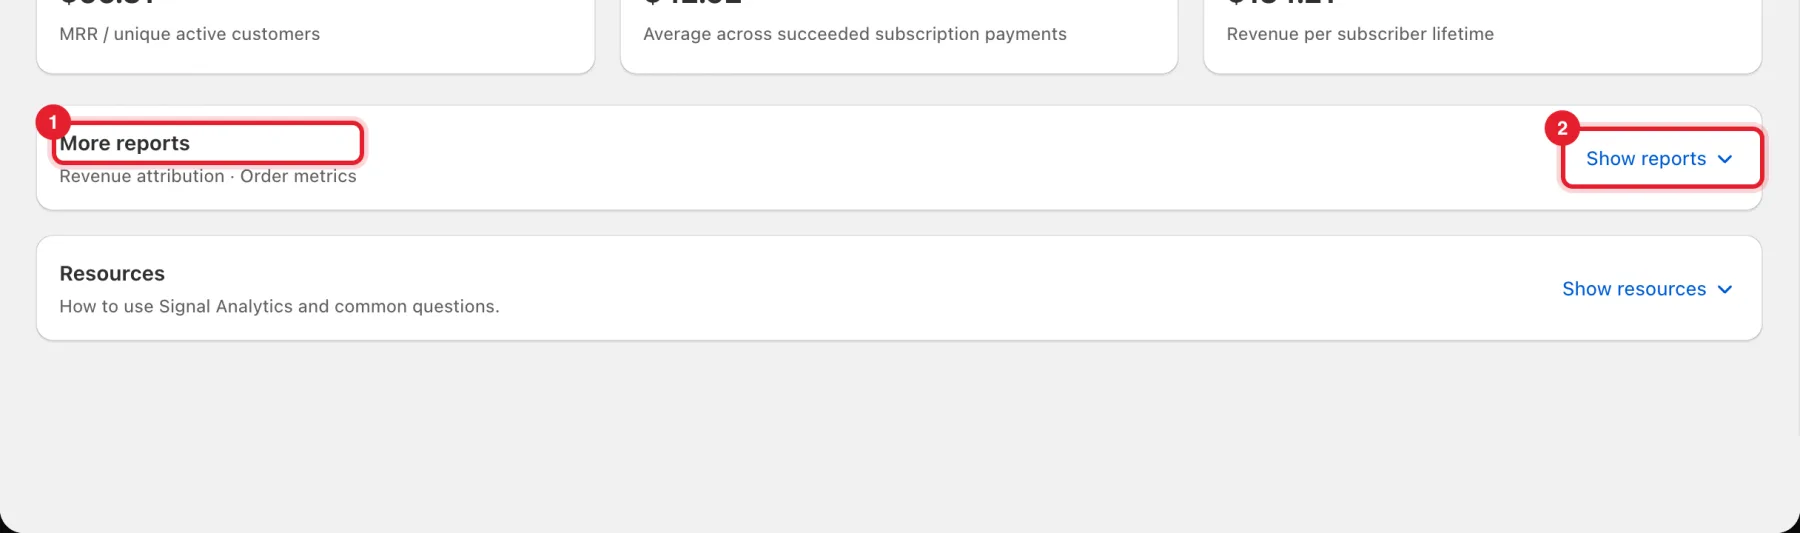
- At the bottom, More reports (1) lists Revenue attribution · Order metrics. Click Show reports (2).
- Revenue attribution (1) shows Where revenue came from (first orders and renewals) and Influenced by, which lists each channel with its Events and Revenue:
- Storefront widget (2) — paid first orders of subscriptions bought through your storefront. Its events include product-page and cart widget activity.
- Cart upsells (3) — cart drawer cross-sells. It shows No data yet until there's activity.
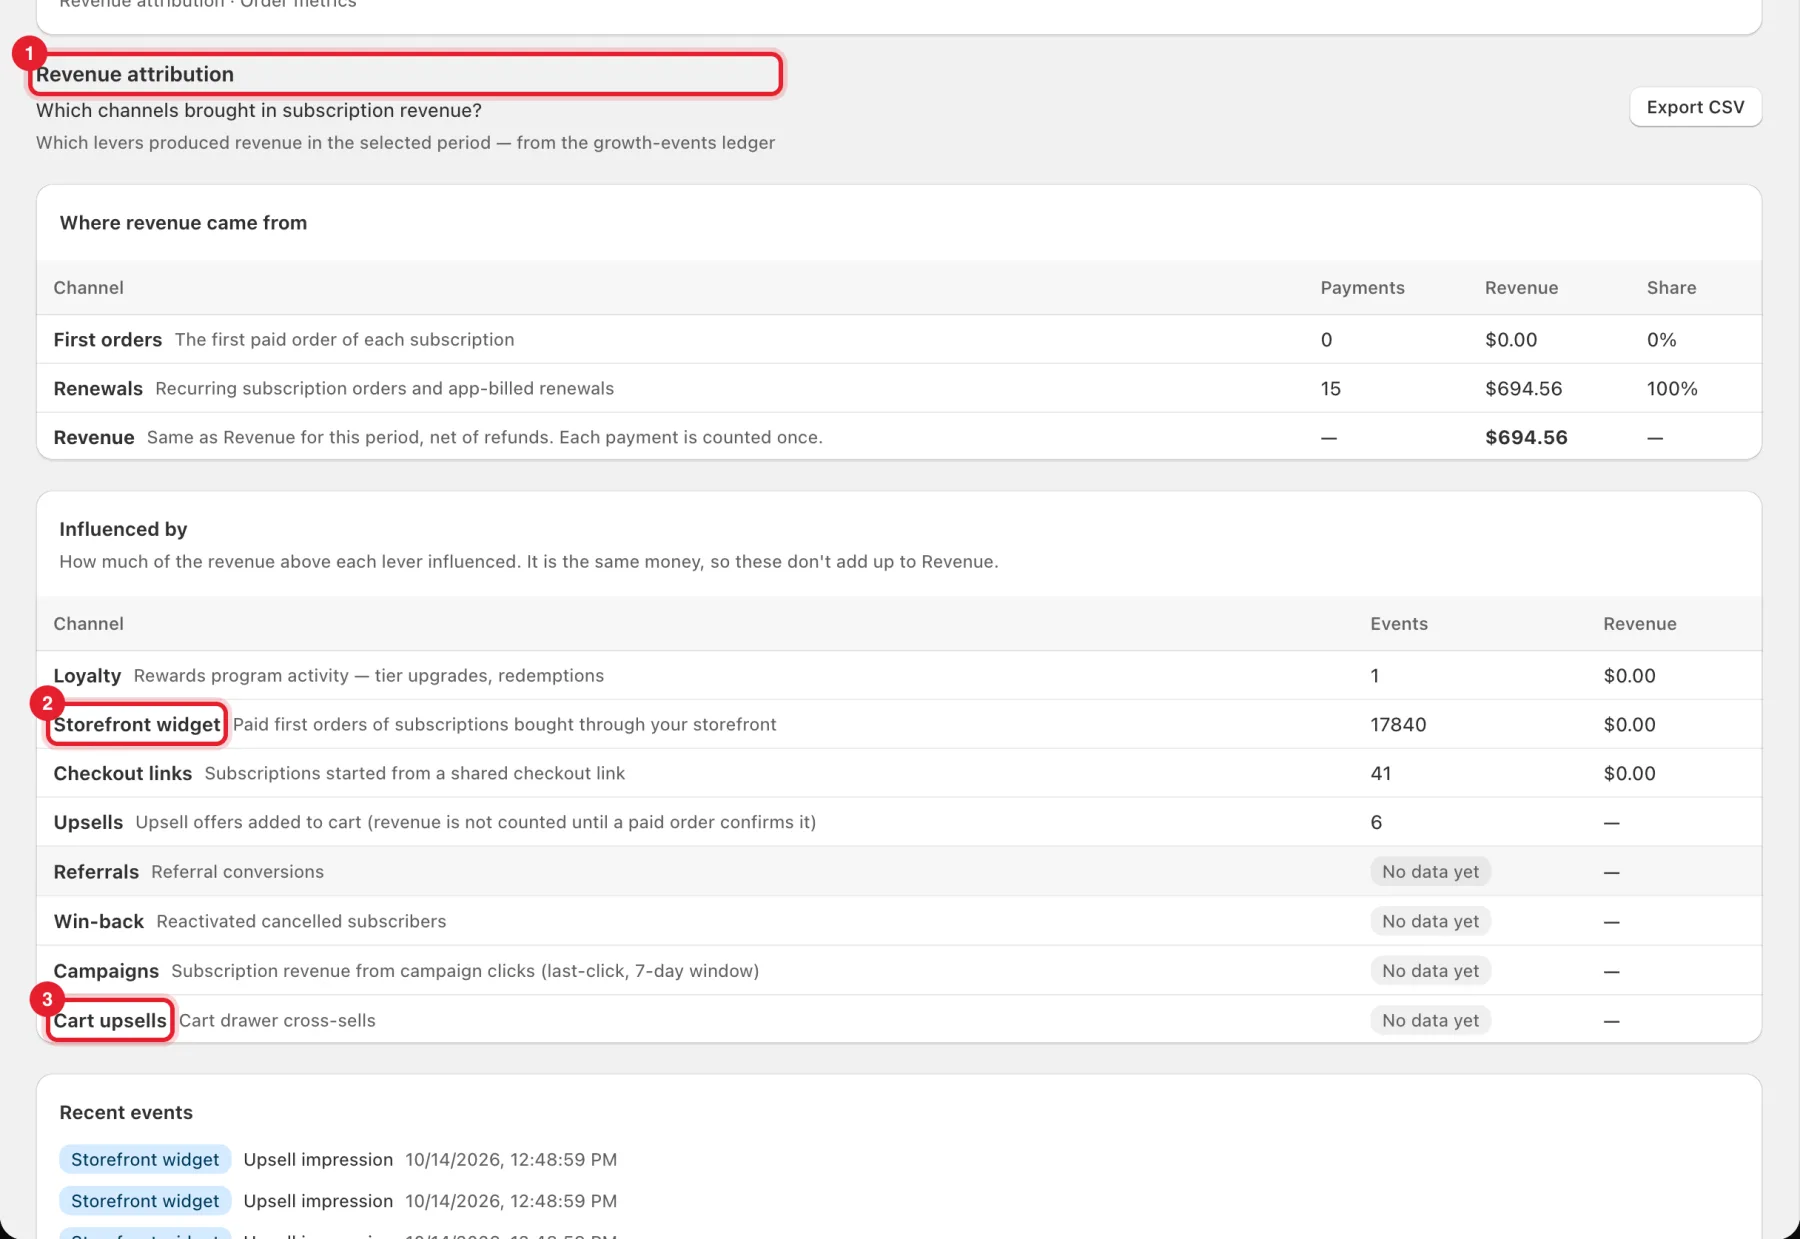
Note: Renewals and lifecycle orders are your actual revenue. The other channels show how much of that same revenue each one influenced, so they don't add up to a total. Click Export CSV to download the table.
Step 2: Read the recent cart events
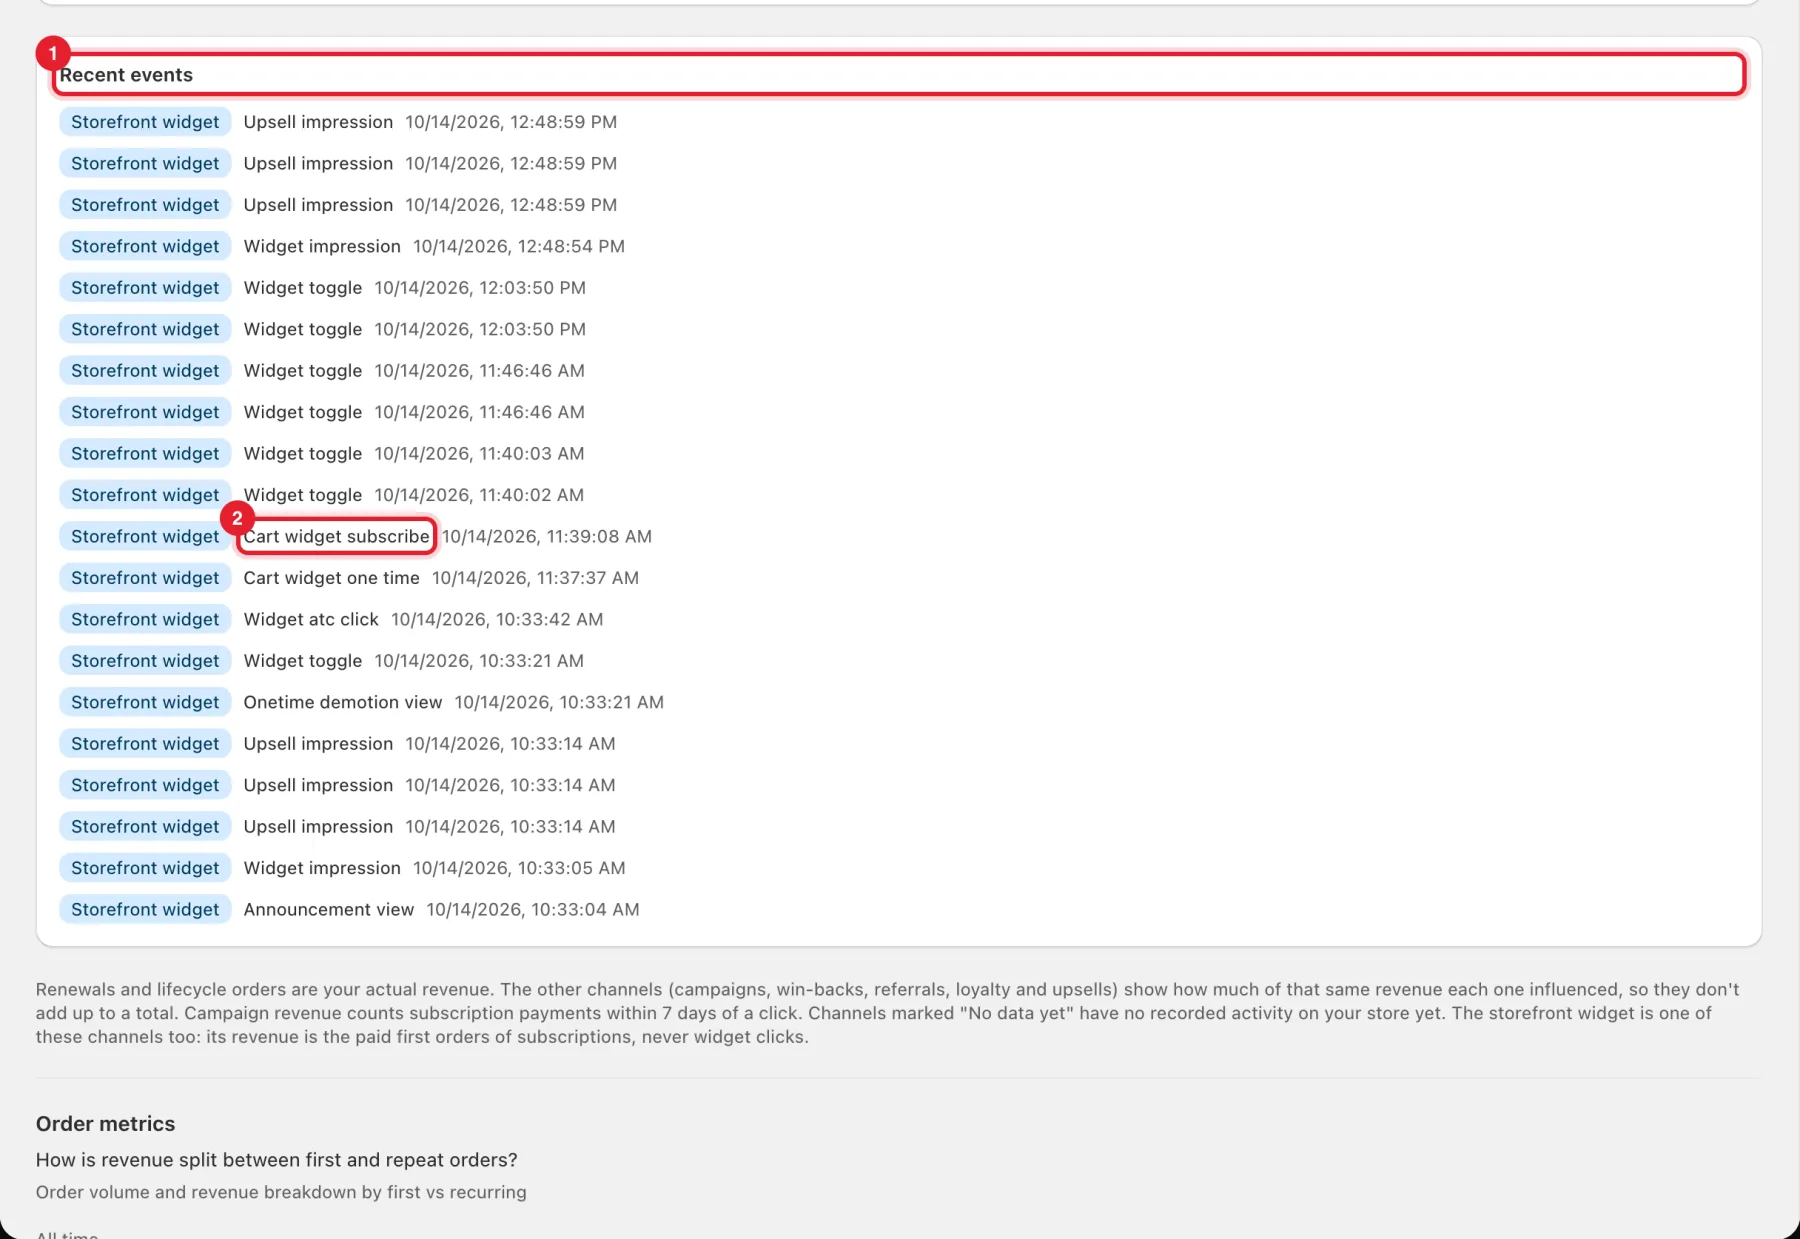
Scroll to Recent events (1). Each line shows the channel, the event and when it happened. Cart events include Cart widget subscribe (2) — a shopper switched an item in the cart to a subscription — and Cart widget one time. You'll also see product-page events such as Widget impression, Widget toggle and Upsell impression.
Step 3: See add-to-cart clicks from the product page
- Go to Growth, and in the Growth performance card click View report.
- Open the Widget tab.
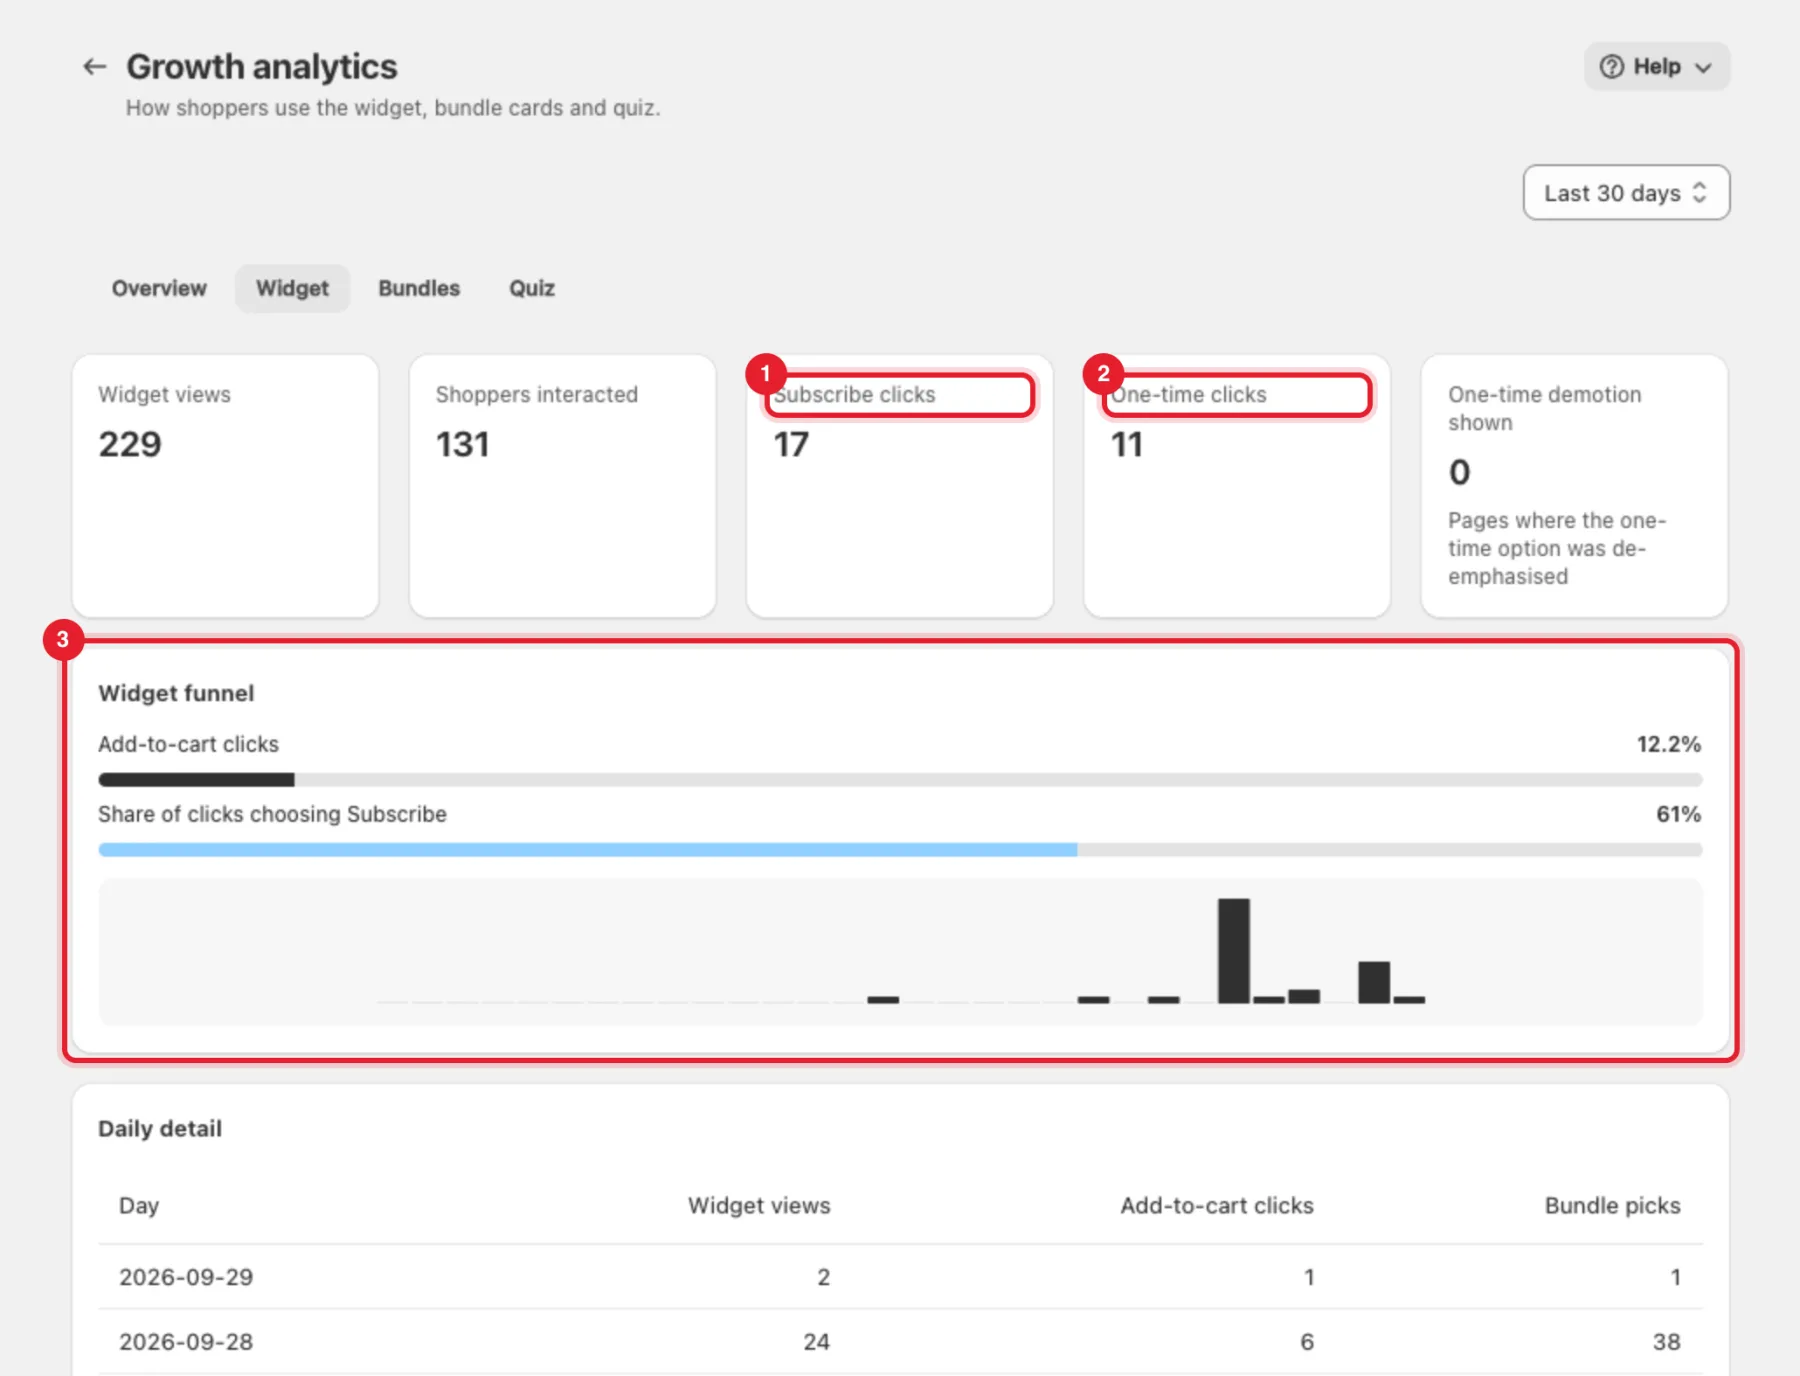
- Subscribe clicks (1) and One-time clicks (2) count add-to-cart clicks from the subscription widget. Widget funnel (3) shows add-to-cart clicks as a share of widget views, and the Share of clicks choosing Subscribe.
For every figure in this report, see Growth analytics.
What isn't measured
RecurX doesn't report cart opens, items per cart, checkout starts or checkout completion rates, and it doesn't split reports by traffic source (UTM) or device. For checkout and conversion funnels, use Analytics in your Shopify admin. Subscription revenue and sign-ups are in Signal Analytics.