
Signal Analytics is where you read the health of your subscription business: recurring revenue, how many subscribers you gain and lose, how long they stay, and what's coming next. Most sections follow the date range you pick. Sections marked Not affected by the date range use their own window.
Who it's for: store owners and anyone tracking subscription growth. The full reports are part of Signal Analytics on the Basic and Pro plans. On an older plan without them, some sections show an upgrade prompt instead.
Step 1: Open Signal Analytics
- In your Shopify admin, open Apps → RecurX Subscriptions and click Signal Analytics in the sidebar.
- Tick Compare to previous period to compare every chart with the period before.
- The tabs split the report: Overview, Revenue, Subscriptions, Retention & churn, Trials & conversion, Experiments, Billing health and Forecast.
- Signal intelligence turns your live metrics into a short list of next steps. Click Analyze to generate them. Each is marked High priority, Medium priority or Low priority. Click Refresh later to generate them again.
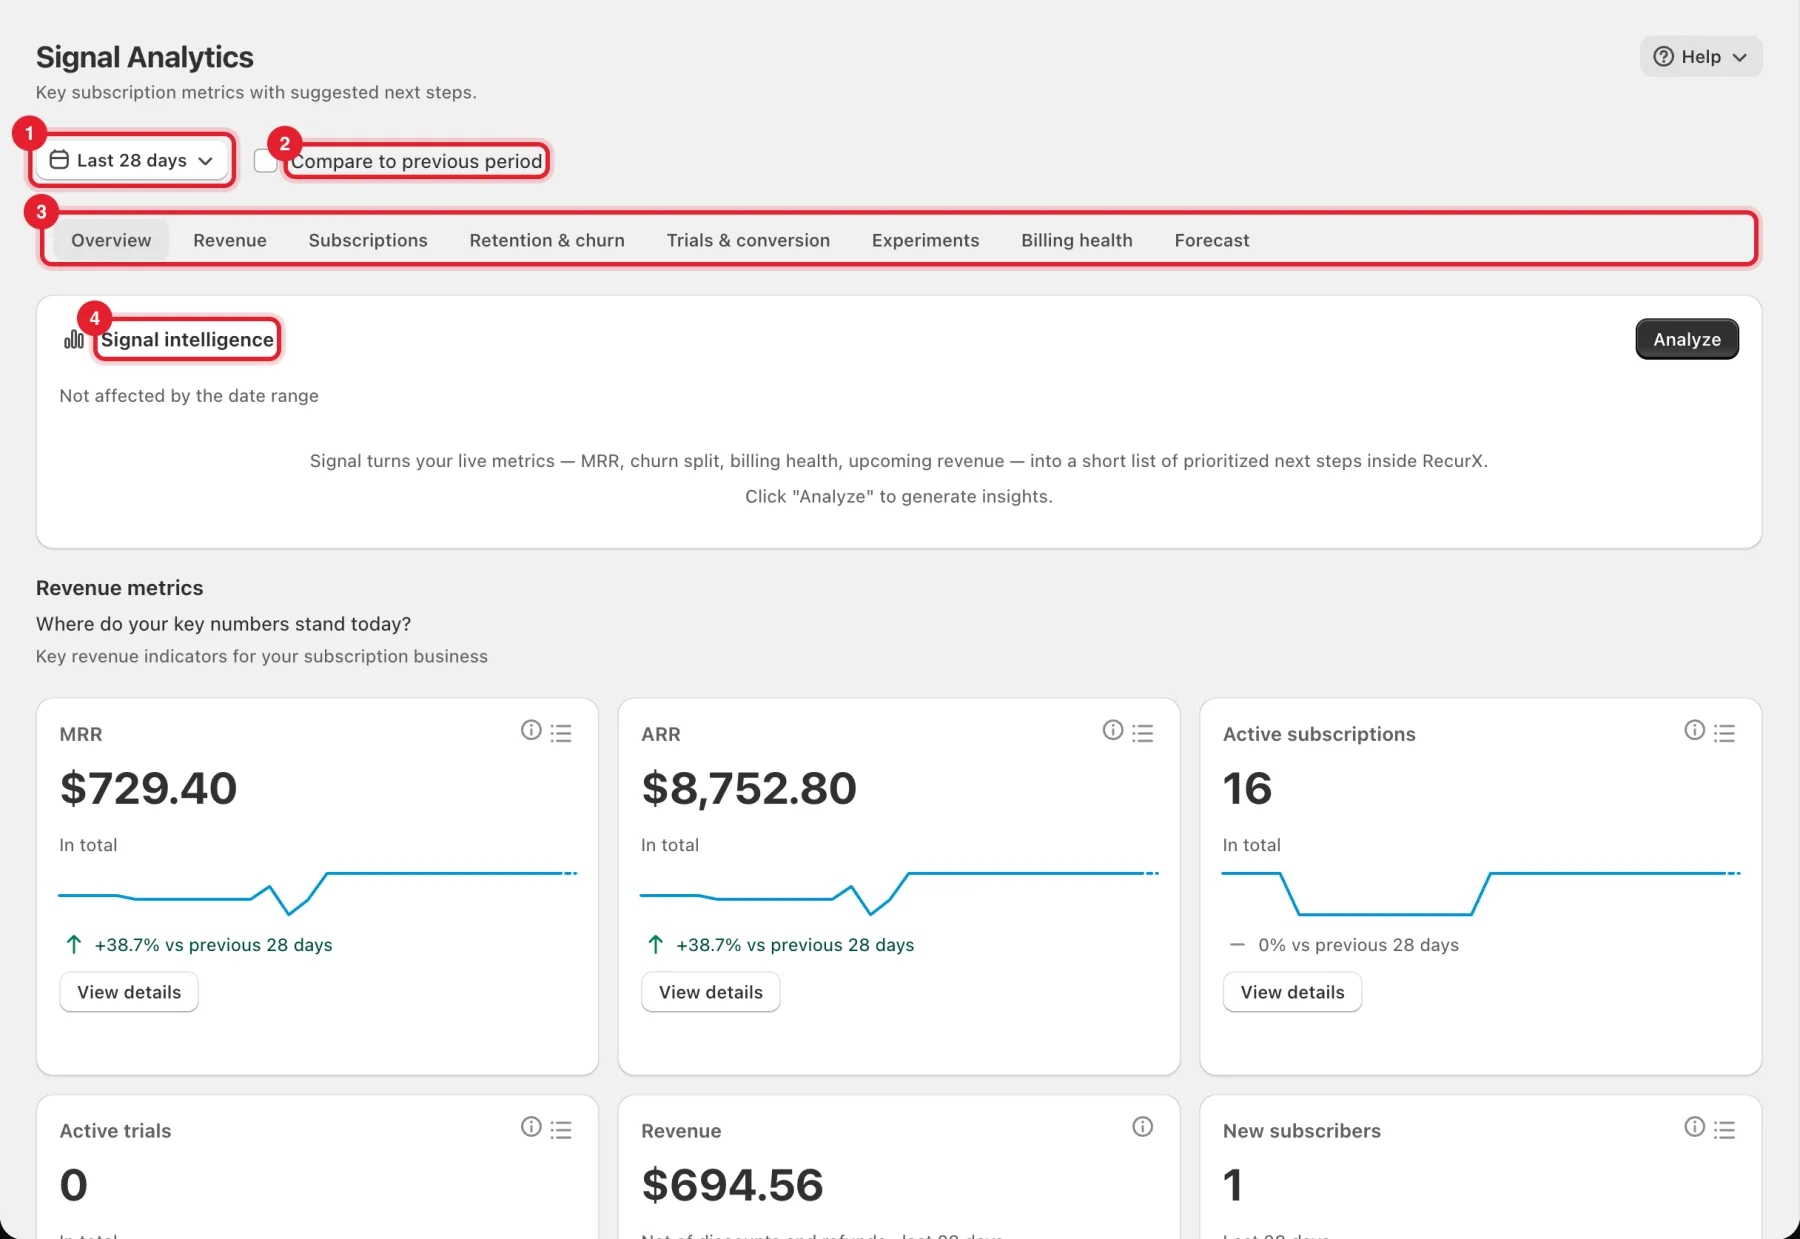
Below it, the Overview shows Revenue metrics tiles: MRR, ARR, Active subscriptions, Active trials, Revenue, New subscribers, New customers, Churn rate and Recovered revenue. Each tile has View details. Further down are the MRR at Risk card and Alerts. See MRR at risk and at-risk subscribers.
Step 2: Pick a date range
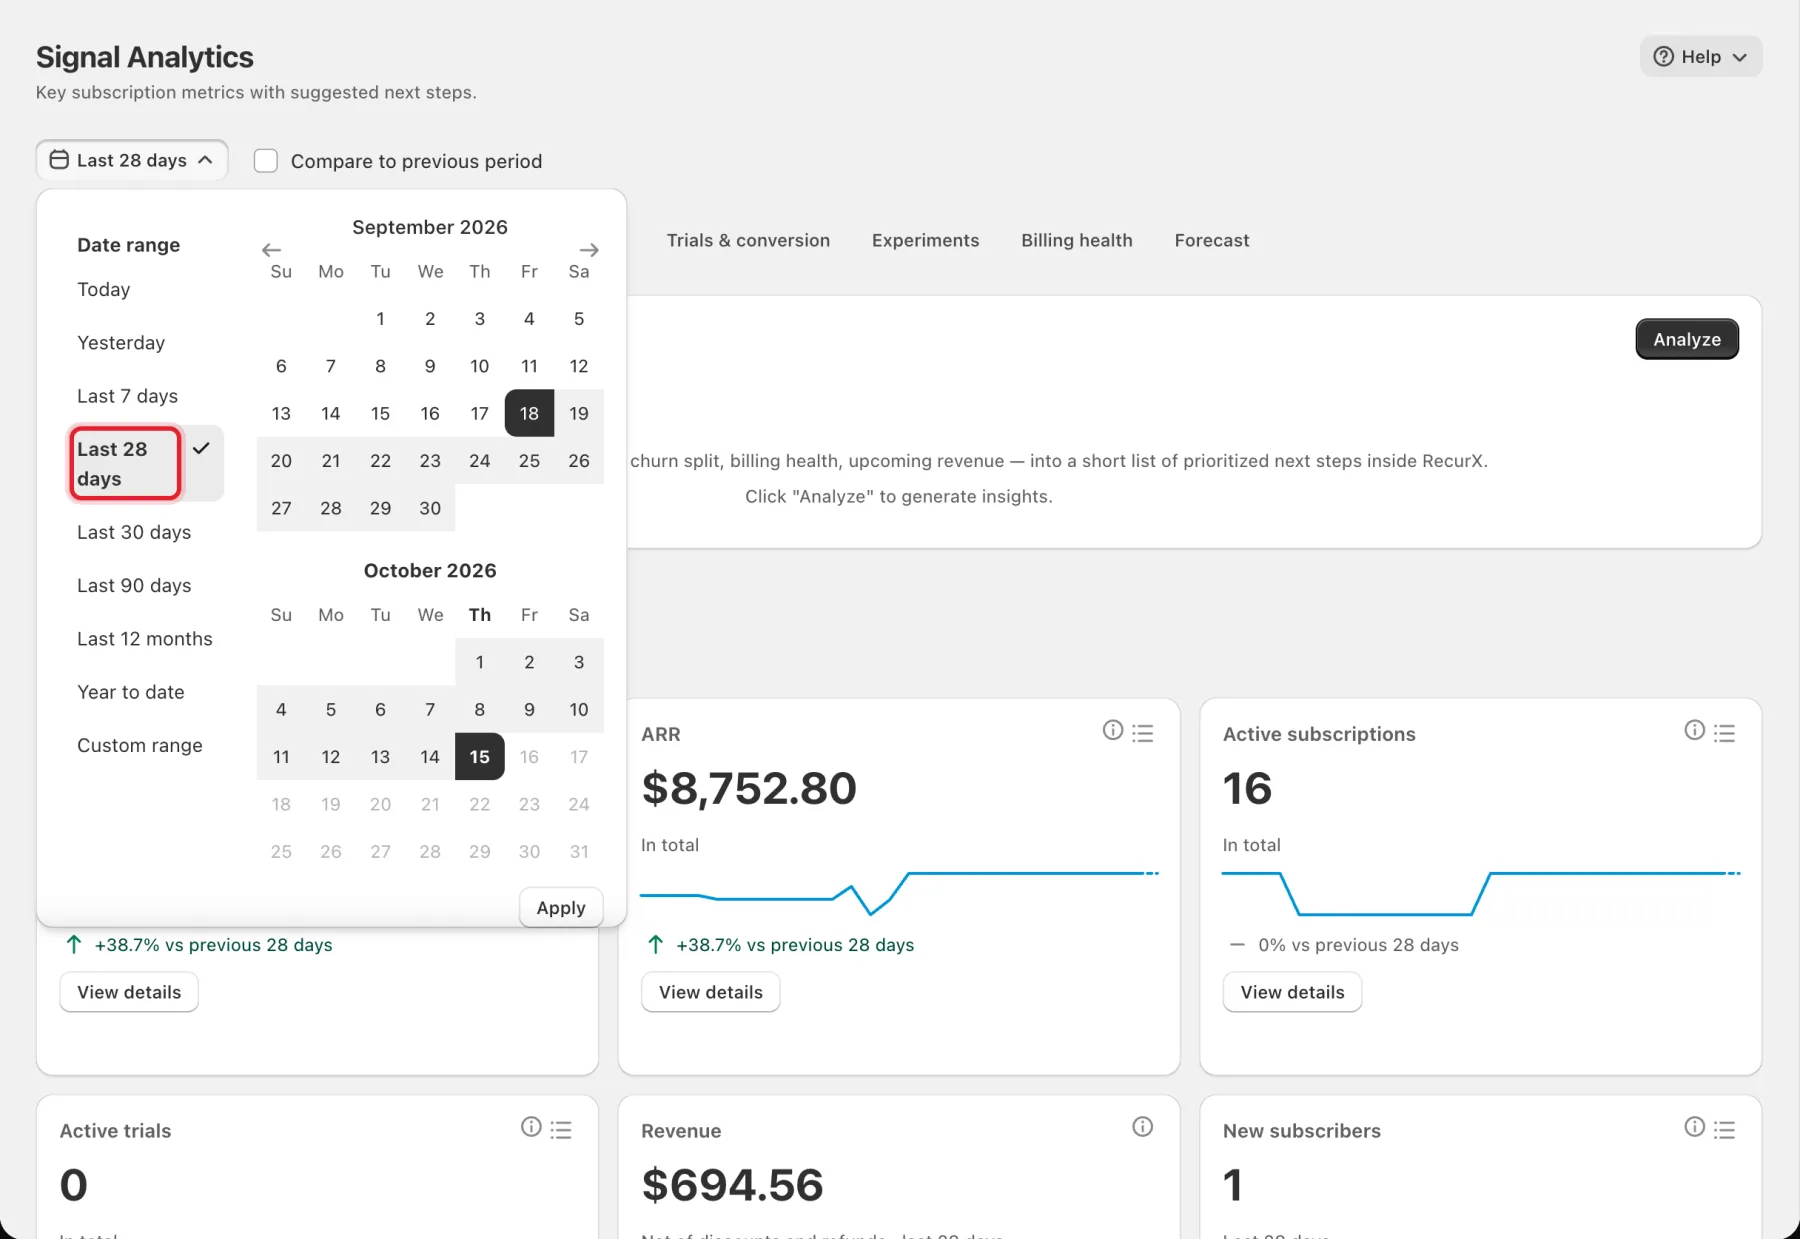
Click the date button (it starts on Last 28 days) and choose Today, Yesterday, Last 7 days, Last 28 days, Last 30 days, Last 90 days, Last 12 months, Year to date or Custom range. For a custom range, pick the first and last day on the calendar and click Apply.
Step 3: Read revenue
On the Revenue tab:
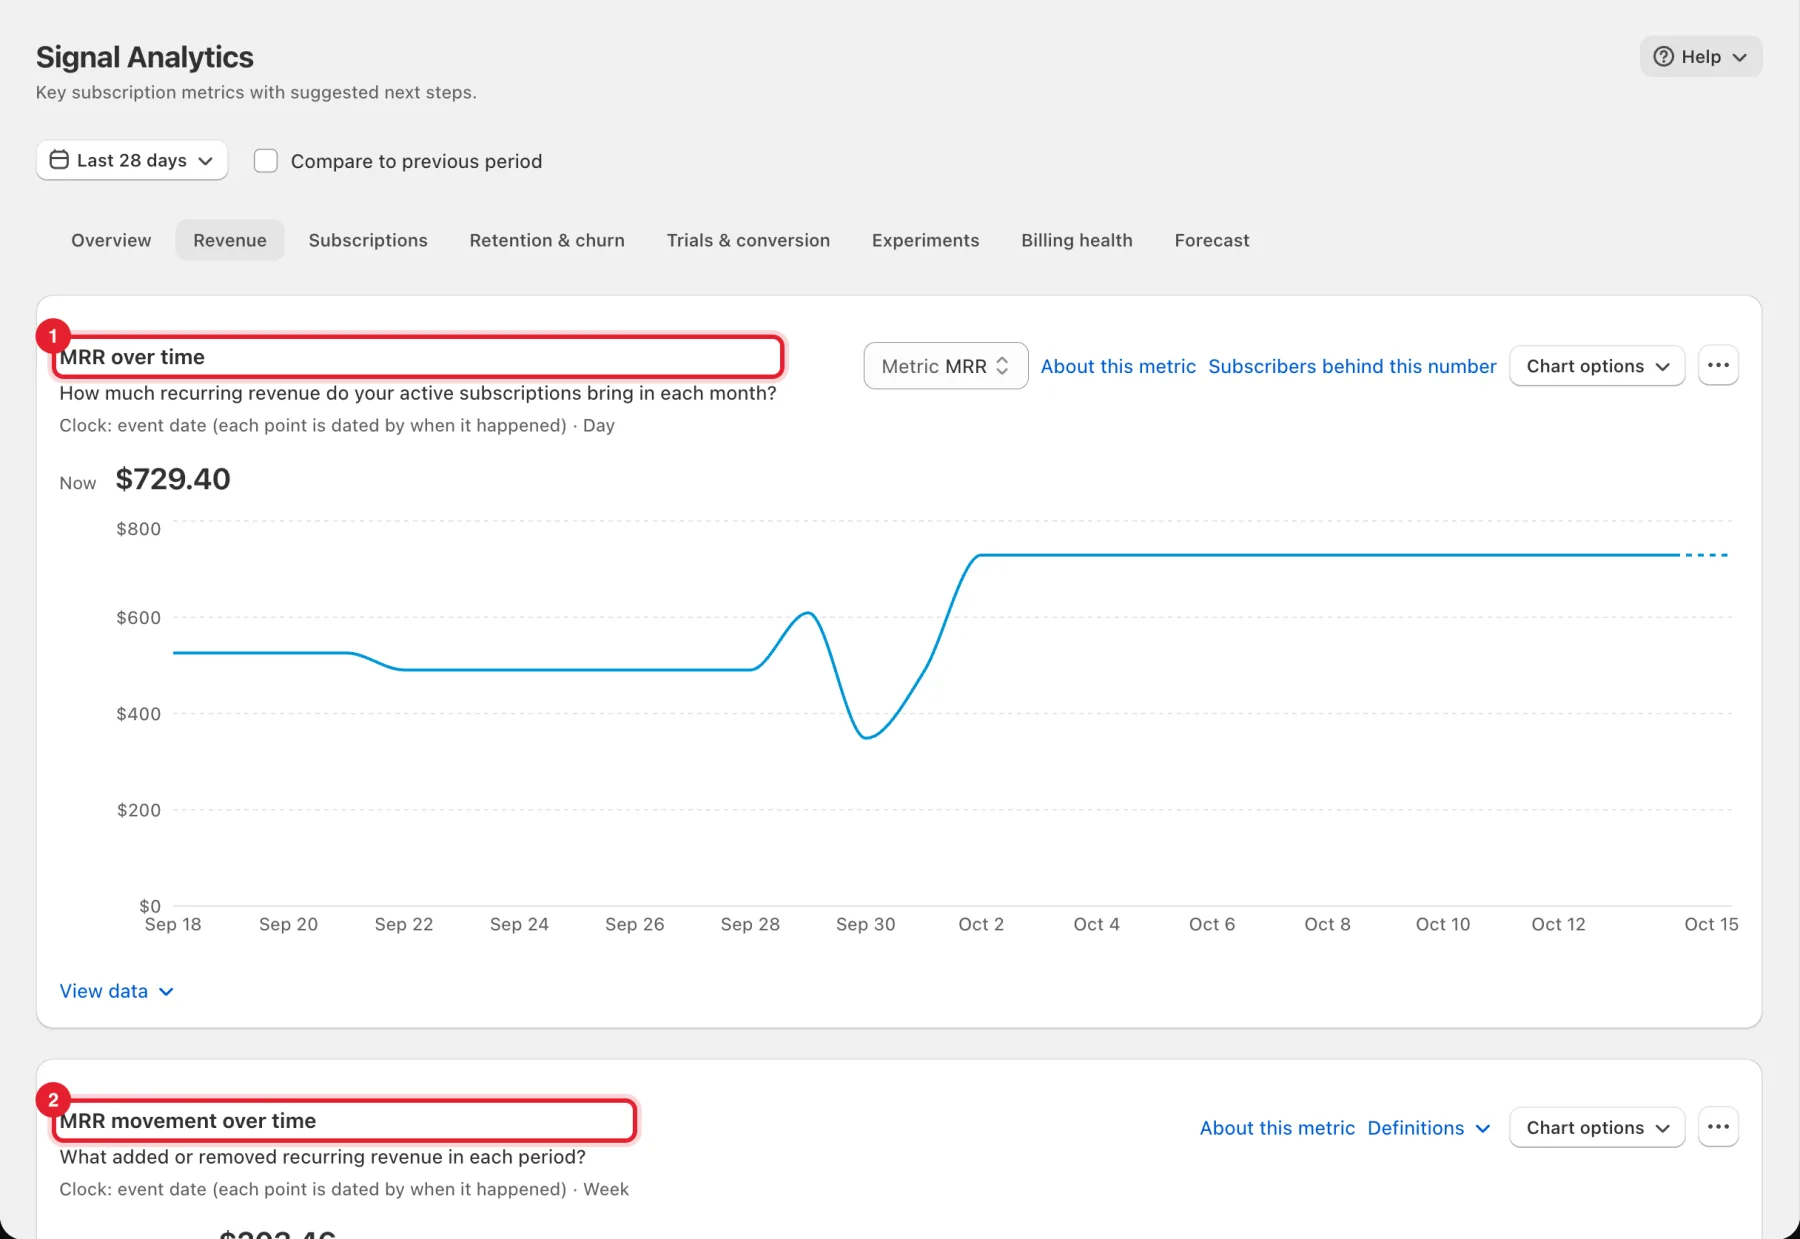
- MRR over time: your monthly recurring revenue per day or week.
- MRR movement over time: what added or removed recurring revenue in each period.
Each chart has a Metric switcher, About this metric, Chart options, View data (the numbers as a table), and Subscribers behind this number where it applies. Further down are Revenue over time and Revenue per customer: Average revenue per user, Average order value and Avg lifetime revenue.
Tip: Open More reports at the bottom of the Revenue tab for Revenue attribution (which channels produced revenue) and Order metrics.
Step 4: Follow subscriptions
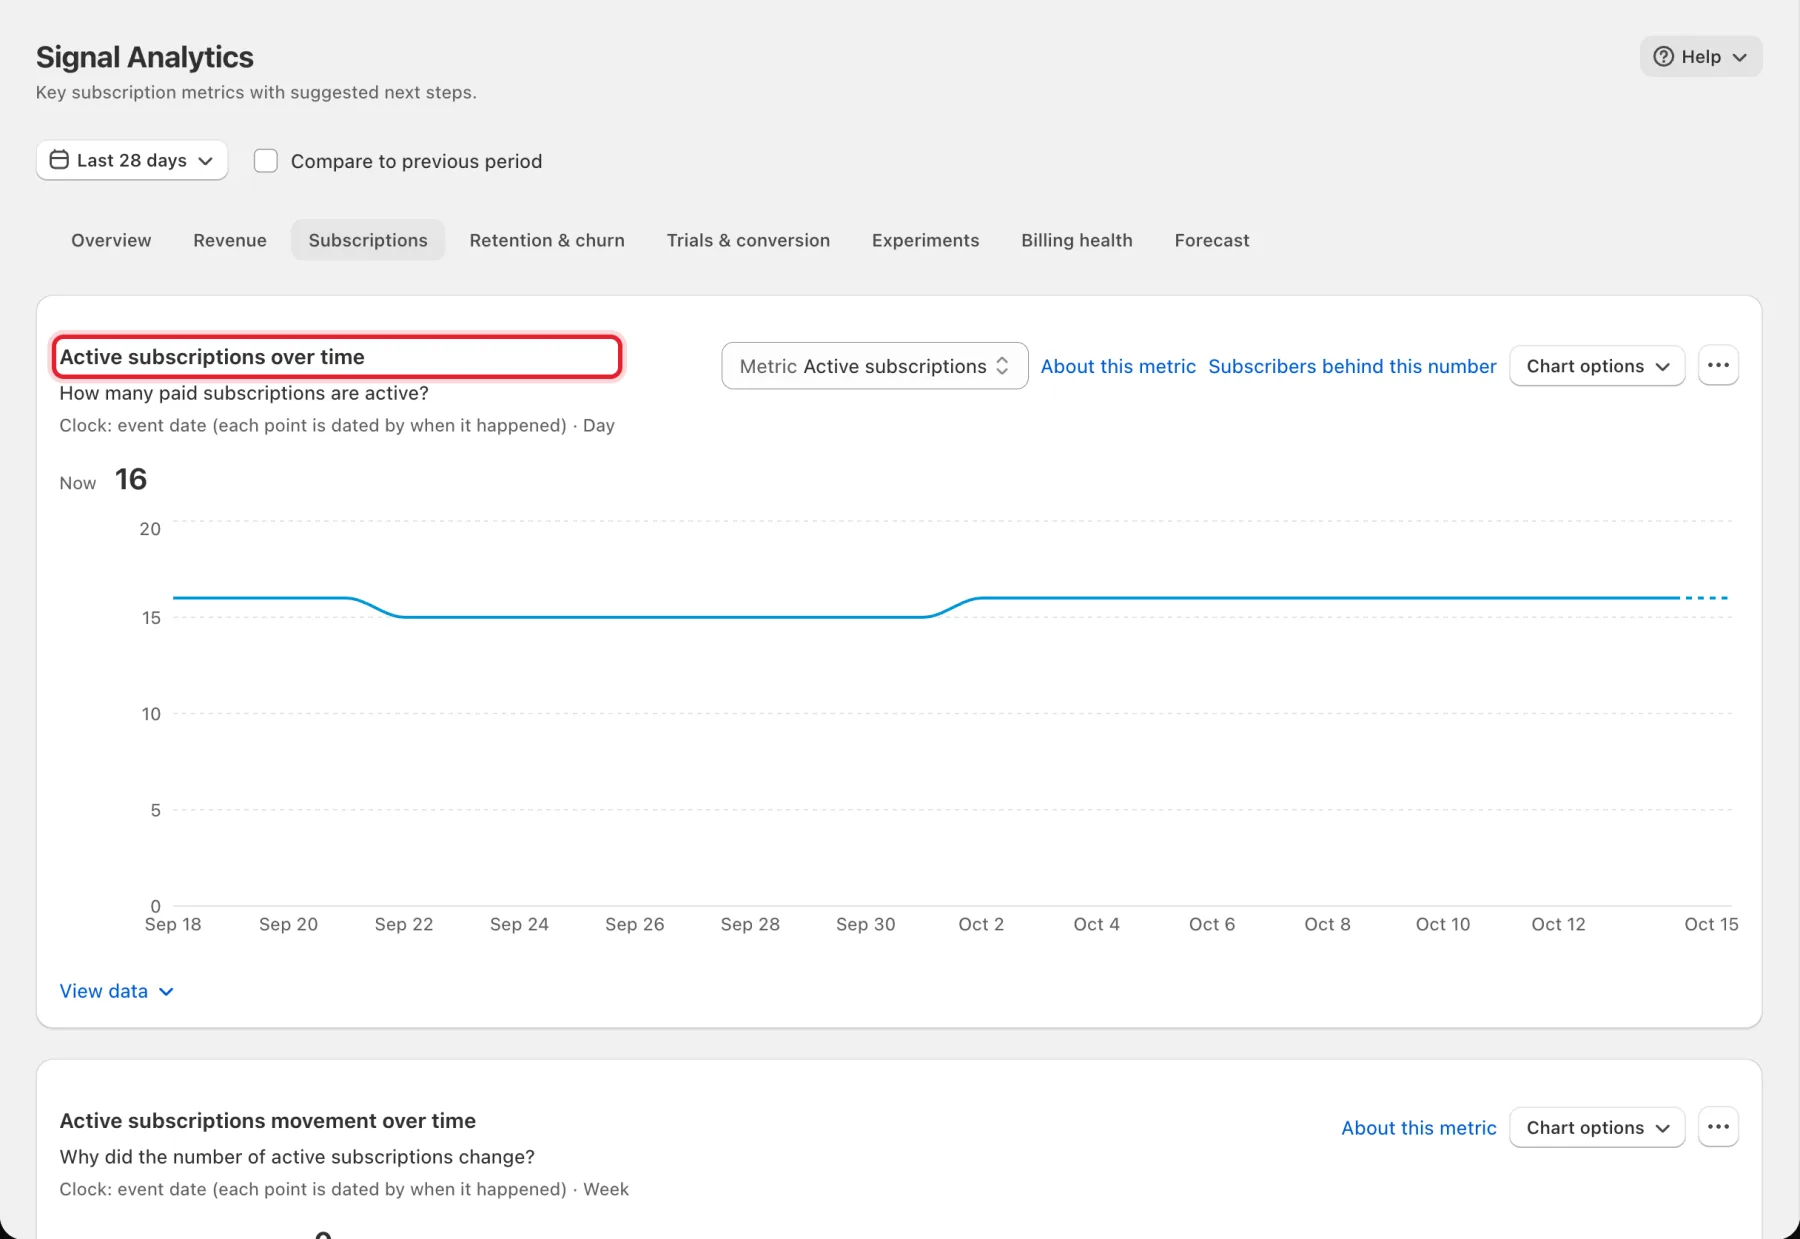
The Subscriptions tab shows Active subscriptions over time, Active subscriptions movement over time (why the number changed), Subscriber metrics, Subscription status and Renewals due by month. More reports at the bottom holds Behavioral segments.
Step 5: Understand churn and retention
Open Retention & churn. After Churn rate over time, Churn analysis splits your losses:
- Voluntary churn: customer-initiated cancellations (or auto-expiry by plan rules).
- Involuntary churn: subscriptions cancelled after payment retries ran out.
Avg retention length and What this means sit next to them. Cohorts follows: choose the Signups included window. The Cohort explorer shows the share of each cohort still subscribed, with Show, Group by and Billing frequency options.
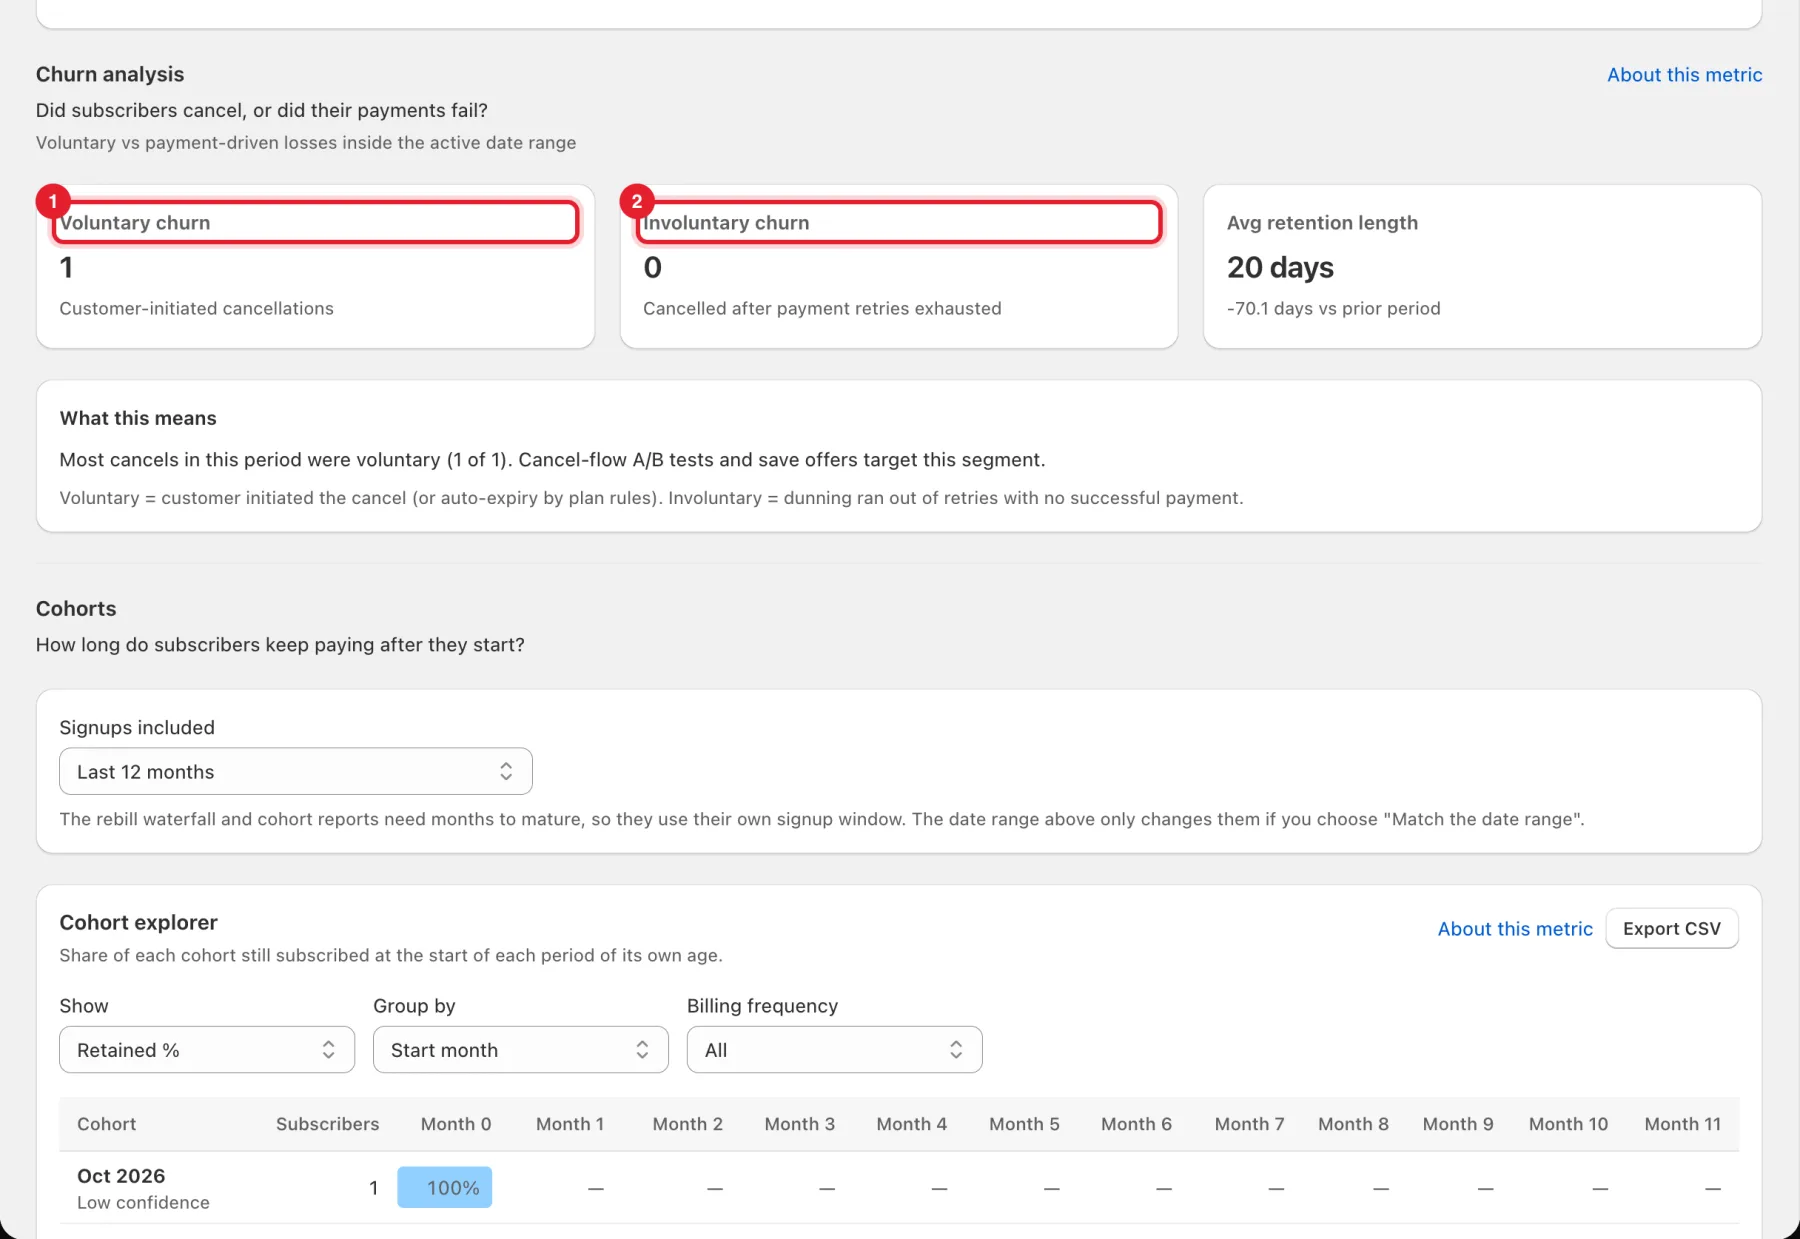
Scroll down for:
- Rebill retention waterfall: the share of a cohort that reached each rebill cycle, from the 1st to the 6th.
- Predicted lifetime value: projected revenue per subscriber, from the observed cohort survival curve and current ARPU. With too little history it says Not enough history yet. Payback period follows.
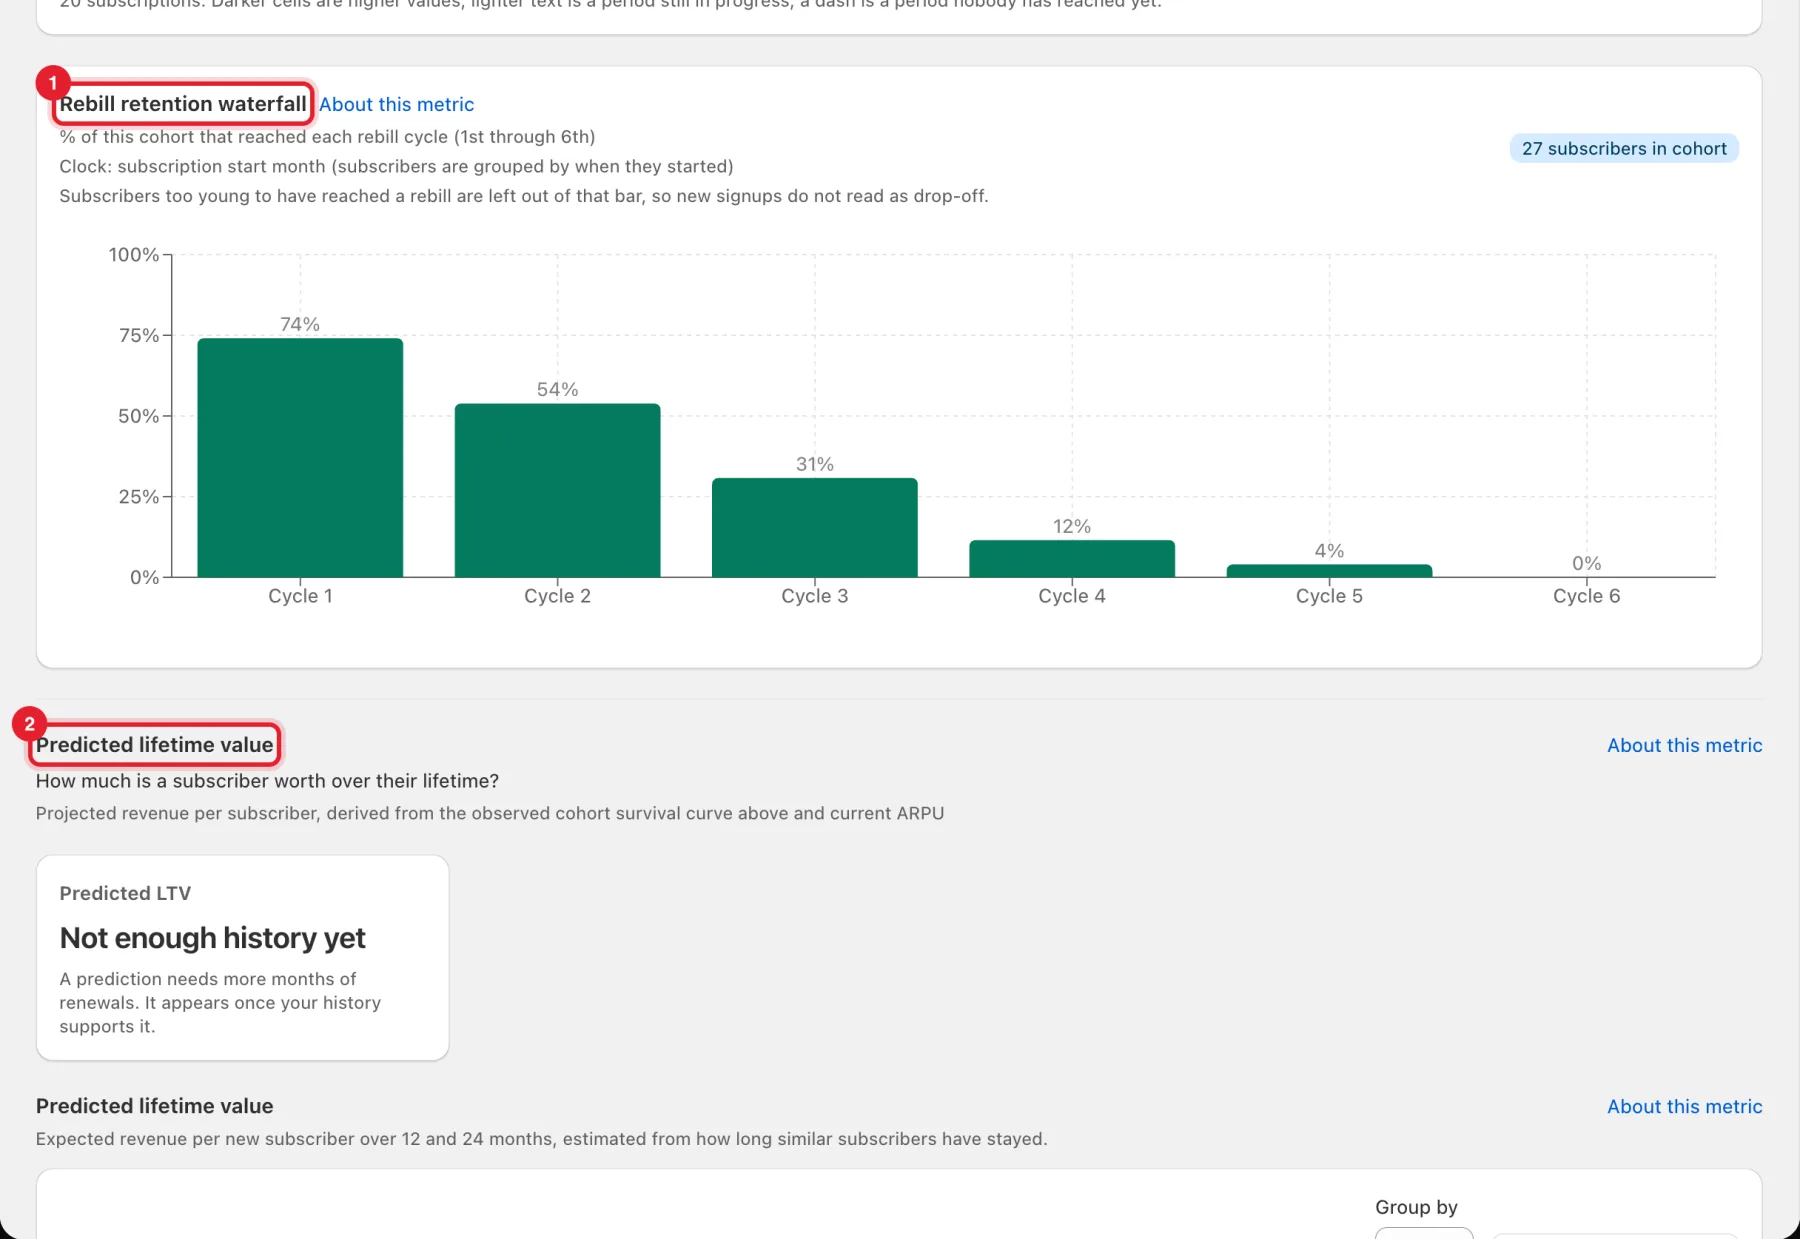
Then Where and why subscribers leave:
- Where subscribers leave: the share who cancel right after each order. The order where most leave is marked Highest, with a button to add a reward on the next order.
- Churn deep-dive: Cancellation reasons, Time to churn, Churn by plan and Involuntary churn — decline codes, with Export CSV.
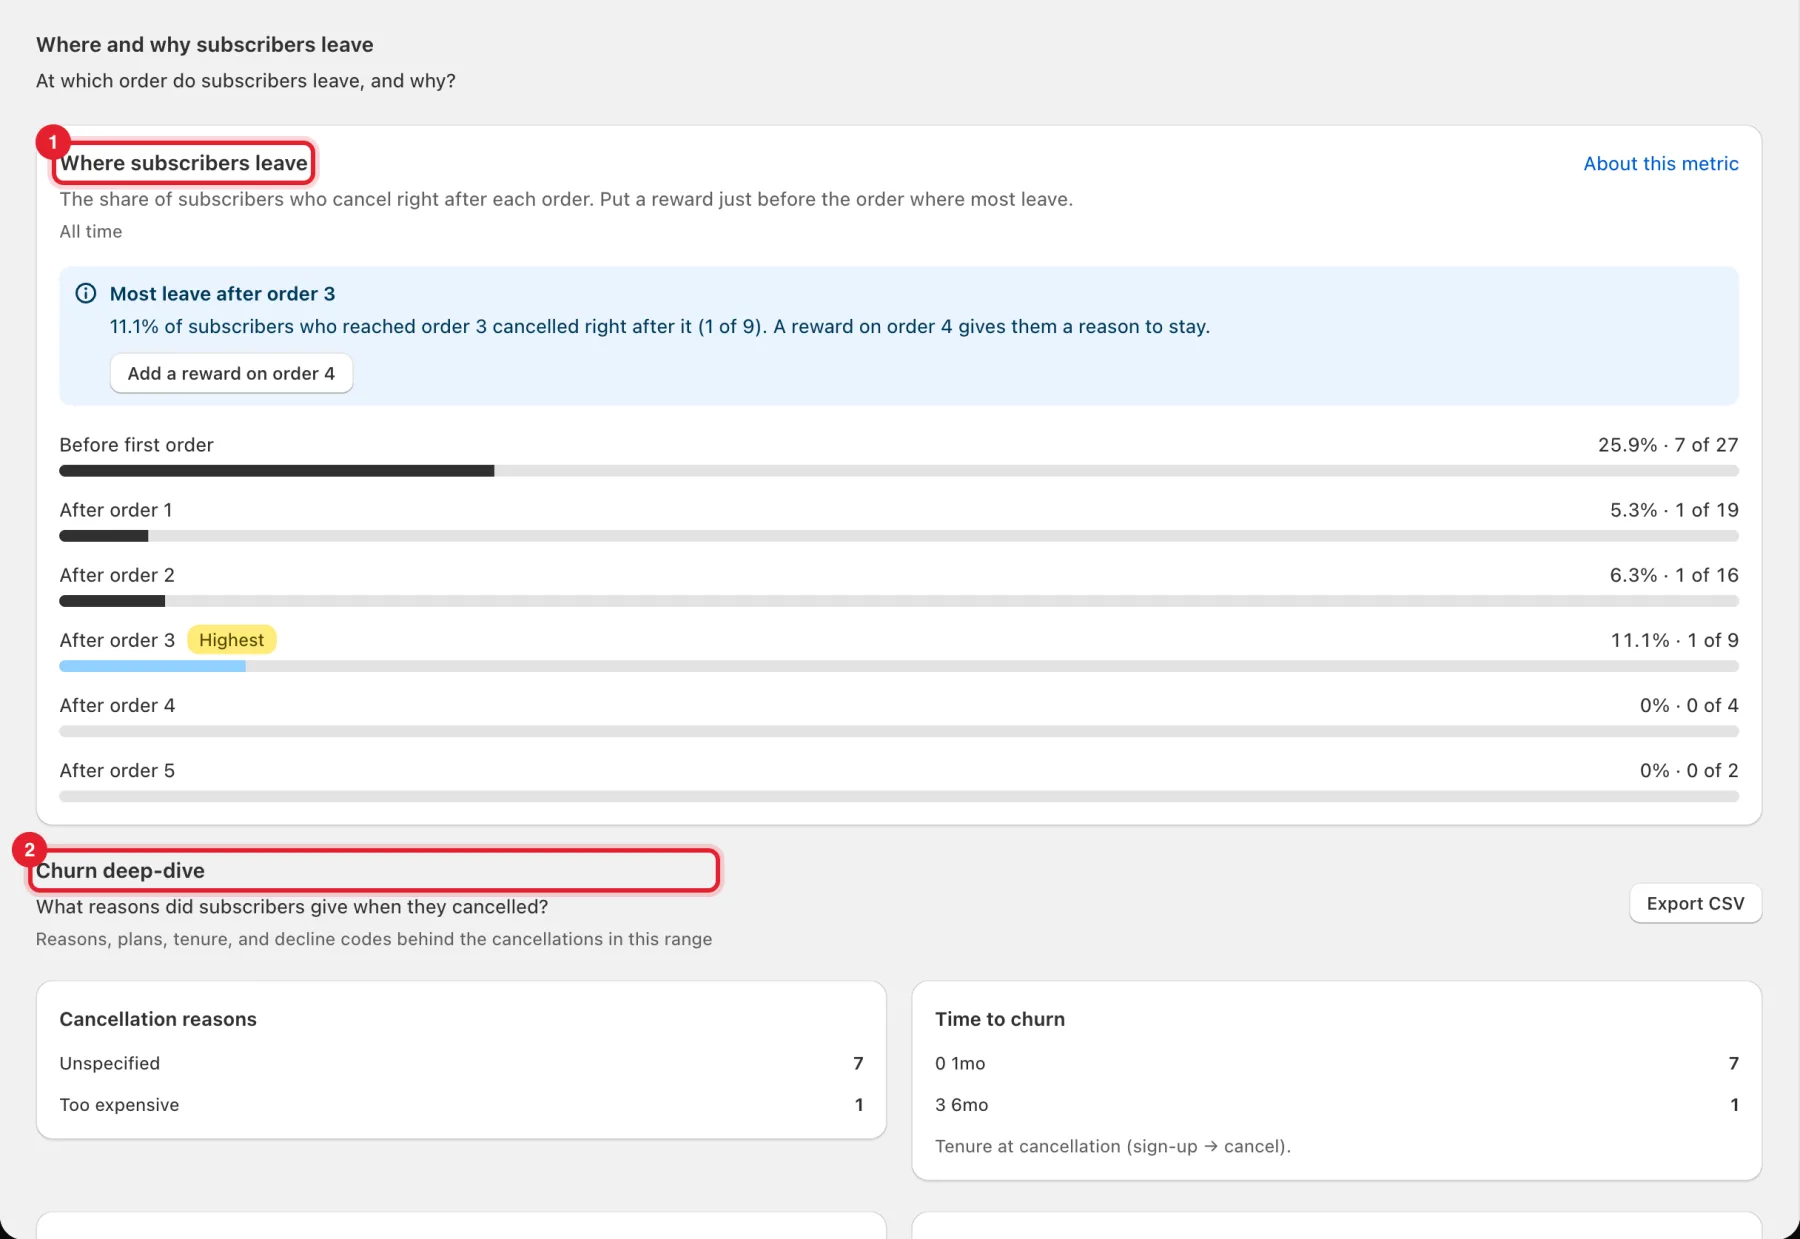
Tip: Cancellation reasons come from your cancel flow. See Build your cancel flow.
Step 6: Check trials and opt-in
On Trials & conversion:
- Subscription opt-in rate: the share of store orders that signed up for a subscription.
- Below it: Active trials over time, Trial conversion rate over time and the Trial → paid funnel.
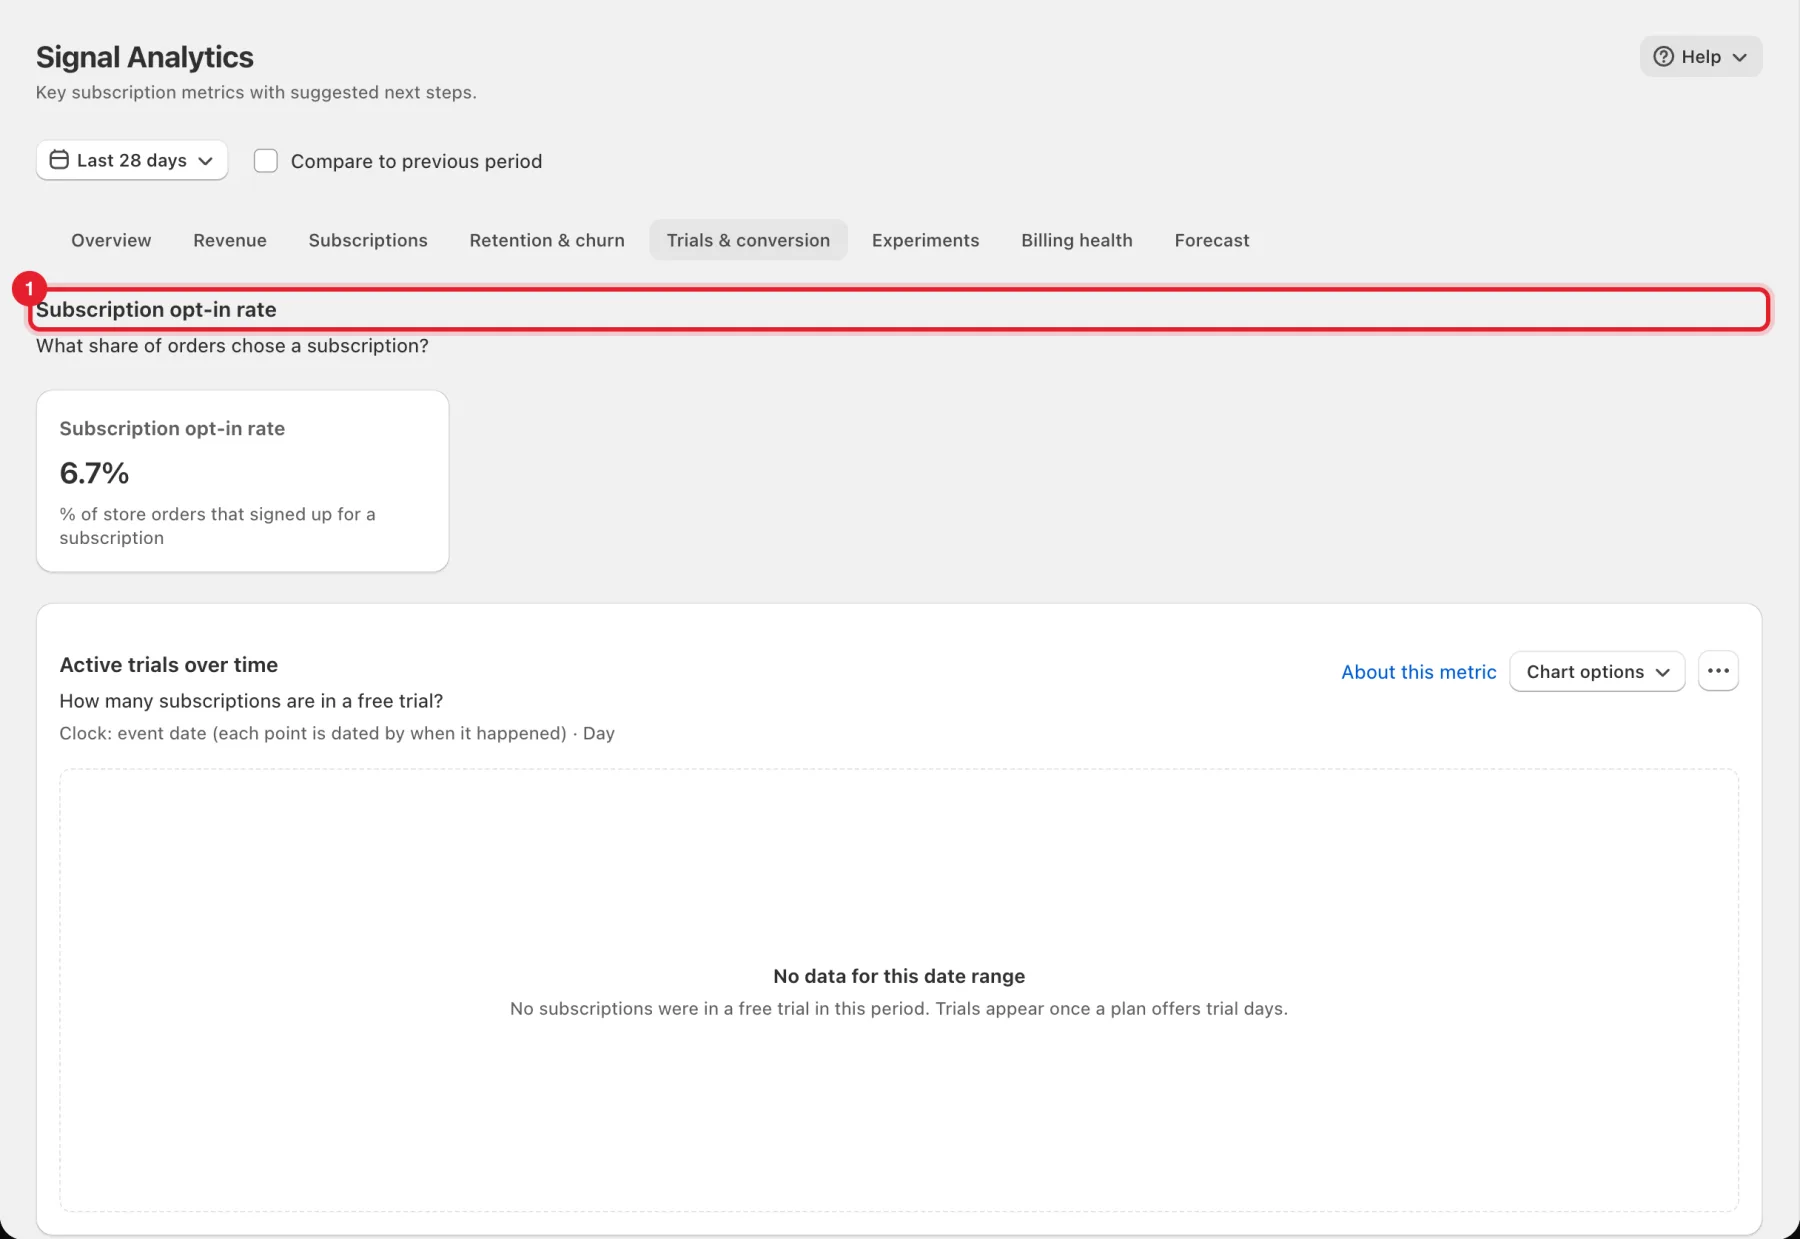
The Experiments tab lists your A/B experiments (Running, Paused, Concluded, Winners found) with Results by experiment.
Step 7: Watch billing health
On Billing health:
- Payment success rates: Overall success rate and First try success rate.
- Recovered payment value: what payment recovery won back.
Further down: Recovered revenue over time, Dunning status, Subscriptions in dunning, Lost billing attempts, Payment volume, Payment outcomes, Failure analysis and Recovery by decline class.
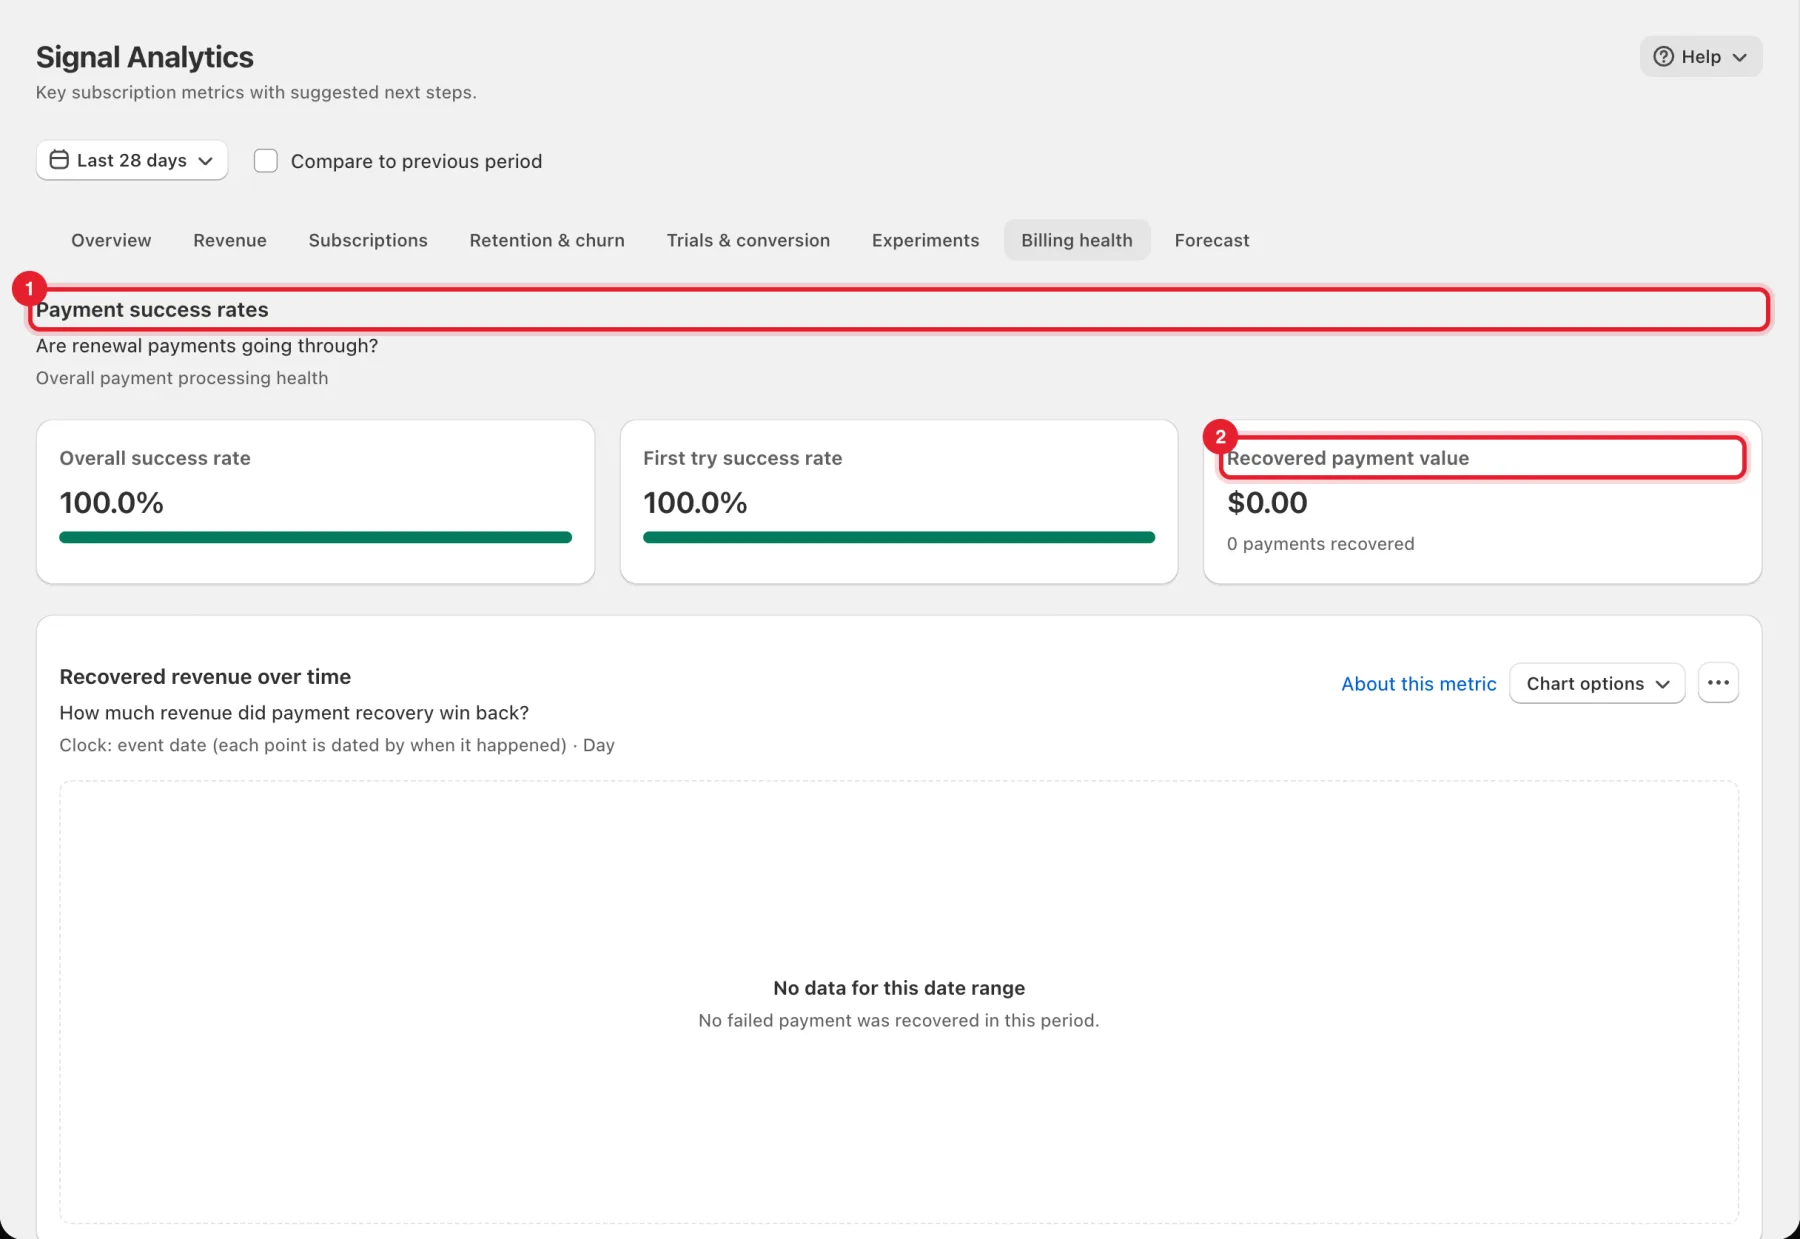
For a single failed payment, see Read the failed payment and retry history.
Step 8: Look ahead with the Forecast
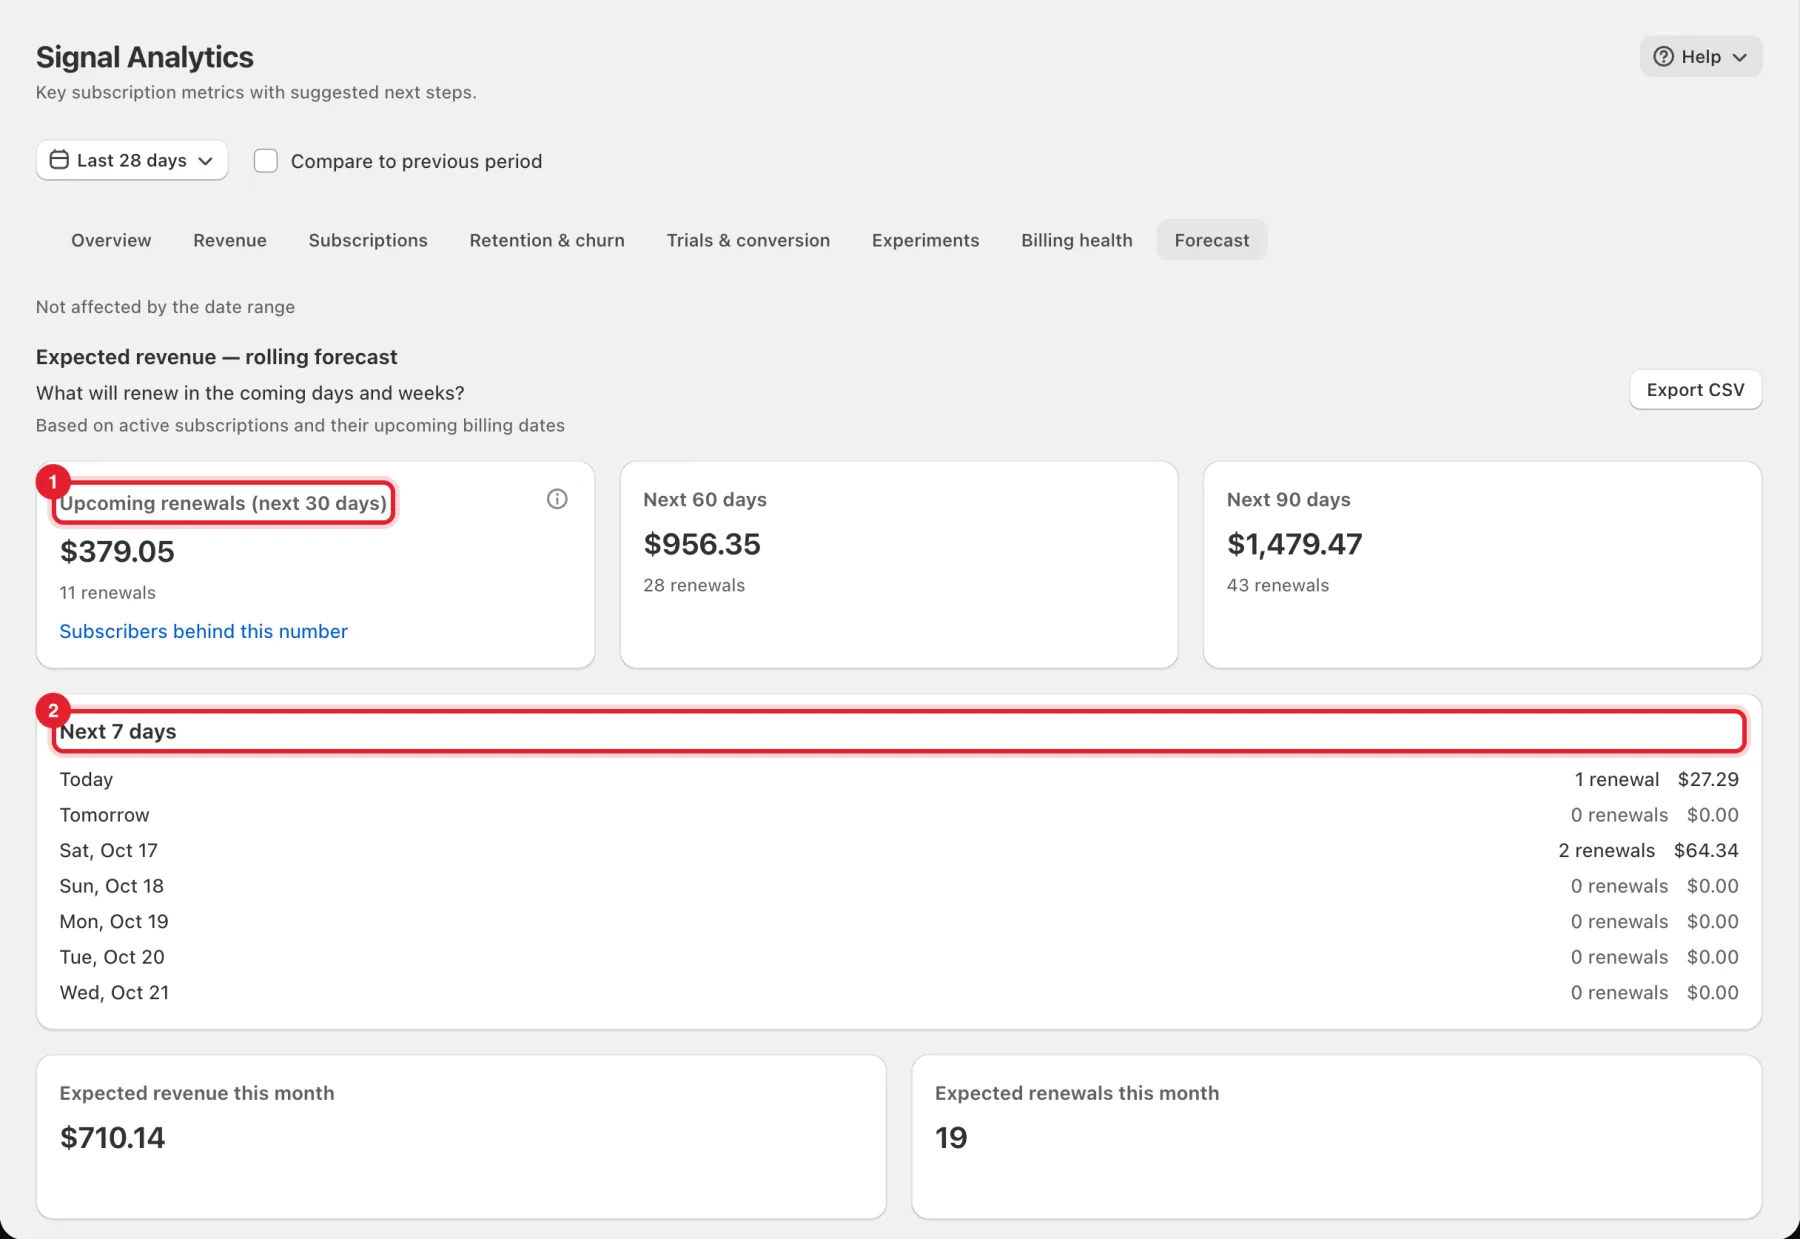
The Forecast tab isn't affected by the date range.
- Expected revenue — rolling forecast is based on active subscriptions and their upcoming billing dates. It shows Upcoming renewals (next 30 days), Next 60 days and Next 90 days.
- Next 7 days lists renewals day by day. Below are Expected revenue this month, Expected renewals this month and a month calendar.
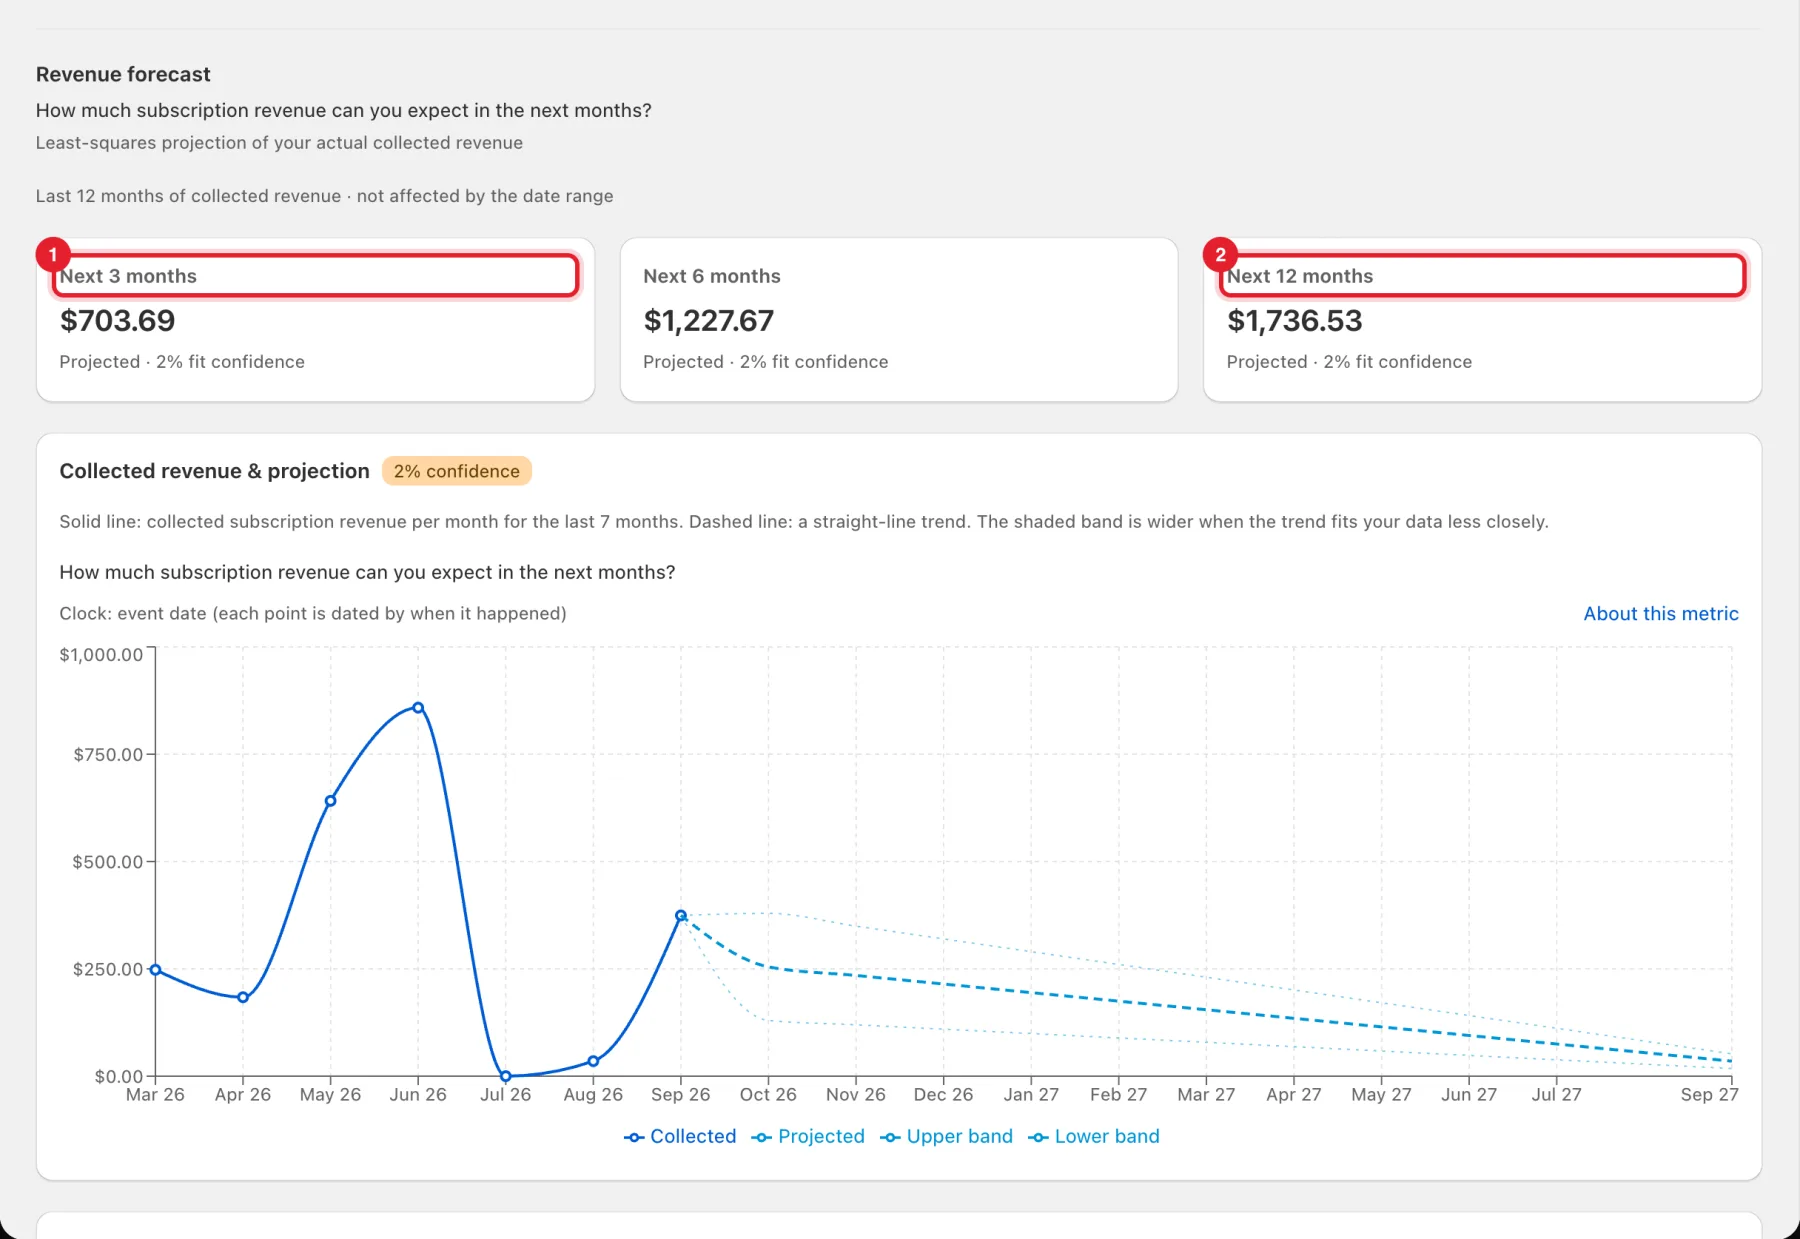
Revenue forecast projects your collected revenue for the Next 3 months, Next 6 months and Next 12 months. It's a least-squares projection of your last 12 months of collected revenue. The fit confidence percentage says how closely the trend fits. With only a few months of history, treat it as a rough guide.
Good to know
- Why does a figure show a dash? A dash means the metric can't be worked out yet (for example no data in the range). It's never a made-up 0%.
- About this metric on each card explains exactly how the number is calculated.
- For widget, bundle and quiz numbers, see Growth analytics. For skipped renewals, email reports and contract exports, see Subscription reports and calendar.